FIGURE 5.

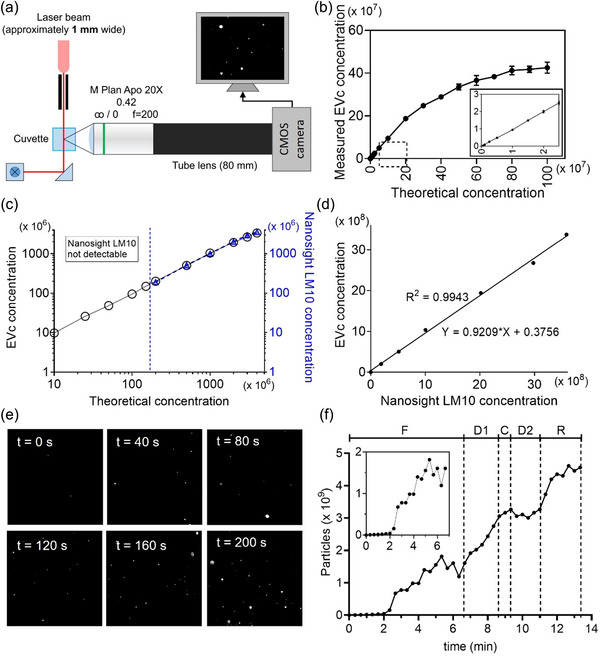
Characterization of EVc. (a) Schematic diagram of EVc system. (b) Calibration curve of EVc system (n = 3). The inset shows the magnified plots for the dashed box area. (c, d) Comparison of measured concentrations by EVc and Nanosight LM10 instrument obtained from the same particle concentration (n = 3). Linear regression analysis from c was presented in (d). (e) Representative time‐lapse images of every 40 s during particle purification using EVi. (f) Changes in particles extracted from the data (e). F, filtration; D1, first diafiltration; C, concentration; D2, second diafiltration; and R, recovery. Inset plot represents the magnified plots for the F step. Data are presented as means ± SD.
