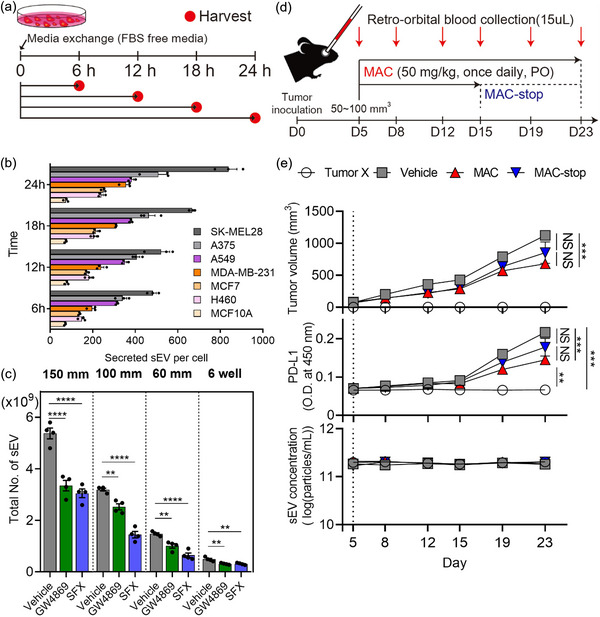
FIGURE 6.

Application of EVics in vitro and in vivo studies. (a) Experimental design of the cellular sEV secretion investigation. (b) Investigation of sEV secretion behavior from various cell lines over time (n = 3). (c) Inhibitory effect of sEV inhibitors (GW4869, SFX) on MDA‐MB‐231 breast cancer cells (n = 4). SFX, sulfisoxazole. (d) Experimental design of syngeneic cancer models. (e) Growth curves of EMT6 (top), levels of plasma sEV PD‐L1 (middle), and plasma sEV concentrations (bottom) of immunocompetent mice subjected to the indicated treatments (n = 5−6). Vertical dotted lines represent the beginning of macitentan (MAC) administration. Data are presented as mean ± SEM. * P < 0.05, ** P < 0.01, *** P < 0.001, and **** P < 0.0001, respectively; NS, not significant; unpaired two‐sided t‐test.
