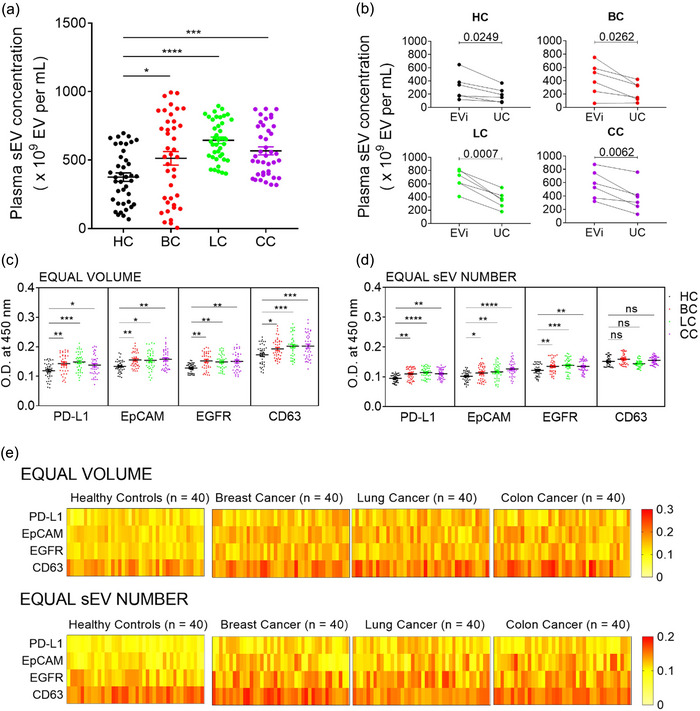
FIGURE 7.

Diagnostic application of EVics. (a) Investigation of human plasma sEV concentrations in various cancer types. We used 100 µL of plasma to isolate sEVs. (b) Comparison of sEV concentrations measured using EVc and different isolation methods. sEVs of six randomly selected plasma samples from each group were isolated by different methods and counted using EVc. (c, d) ELISA for cancer diagnosis. Plasma sEV samples from healthy controls (n = 40) and patients with cancer (breast cancer, lung cancer, or colon cancer, n = 40 for each group) were analyzed. The relative expressions of three cancer‐related markers (PD‐L1, EpCAM, and EGFR) and CD63 were measured using ELISA. Equal volumes (c) of sEVs (equivalent to 25 µL of plasma sEVs) or equal numbers (d) of sEVs (1 × 10 (Moon et al., 2016) sEVs) were loaded into a 96‐well plate and analyzed. (e) Heatmap of analyzed data from (c) and (d). Data are presented as mean ± SEM. * P < 0.05, ** P < 0.01, *** P < 0.001, and **** P < 0.0001, respectively; ns, not significant; Dunnet's multiple comparisons test.
