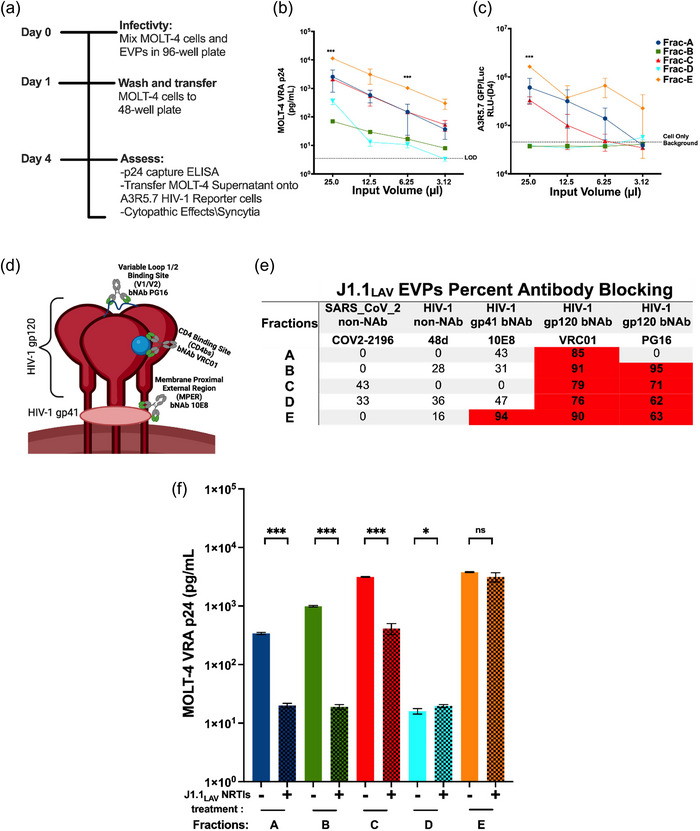
FIGURE 6.

J1.1LAV EPs MOLT‐4 Virus recovery assay (VRA) with HIV‐1 monoclonal virus blocking and MOLT‐4 VRA assessment of viral production interference with NRTIs. (a) MOLT‐4 VRA assay schematics. (b) MOLT‐4 VRA supernatant HIV‐1 p24 pg/well levels measured on day 4 MOLT‐4 VRA initiation (LOD) Limit of Detection; (c) MOLT‐4 VRA supernatant transferred onto HIV‐1 A3R5.7 GFP/Luc viral indicator cells, where 4 days post‐transfer luciferase (Luc) activity was developed and measured as relative light units (RLU); (d) Model of HIV‐1 envelope glycoprotein (gp) with gp120 broadly neutralizing antibody (bNab) PG16 specific to the V1/V2 loop or VRC01 specific to the CD4bs, respectively, with gp41 specific bNab 10E8; (e) HIV‐1 bNAb blocking data, where equal volumes of EPs fractions were mixed with 12.5 µg/mL HIV‐1 bNAb to a final mAb concentration of 6.25 µg/mL or PBS (mock). The percent MOLT‐4 VRA infectivity reductions were calculated as a function of HIV‐1 p24 reduction compared to the PBS mock tread control wells. The data represents the percent average of two individual antibody blocking experiments where HIV‐1 non‐neutralizing antibody (non‐NAb); (f) NRTIs viral production interference, where the EPs fractions were recovered from naïve J1.1LAV or J1.1LAV NRTIs‐treated cells cultures and used in MOLT‐4 VRA and at day 4 p24 (pg/mL) was measurement with p24 capture ELISA, the input for the fractions was normalized within each pair based on the EPs counts. Data represents mean ± standard deviation (SD) of three technical replicate measurements. Statistical significance was calculated for panel (a and b) with One‐way ANOVA with Tukey's post‐hoc analysis multiple comparisons test and for panel (f) with two‐tailed unpaired Student's t‐test significance level *P < 0.05, **P < 0.01, ***P < 0.001, ****P < 0.0001 significance level.
