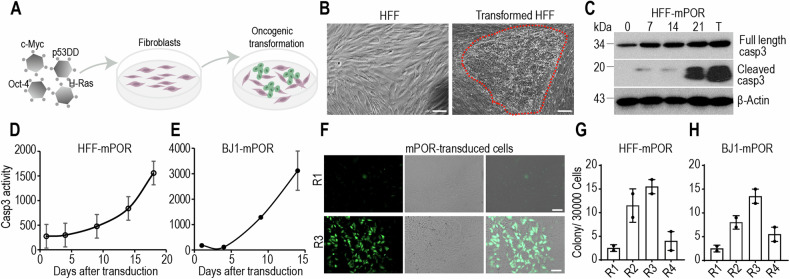
Fig. 1. Caspase-3 activation in oncogene-induced transformation.
A Schematic representation of normal fibroblasts reprogrammed into malignant cells by exogenous expression of oncogenic cocktail (c-Myc, p53DD, Oct-4, and H-Ras, mPOR). B Representative transformed colony of mPOR-transduced HFF cells at day 21 post transduction. The red demarcated line indicates the transformed colony. The scale bar represents 200 μm. C Western blot analysis of cleaved caspase-3 in HFF cells at different time points post mPOR oncogene transduction. T represents malignant transformed cells. β-Actin was used as protein loading control. The blots for cleaved-casp3, full-length casp3 and β-Actin were run on separate gels. The dynamic luciferase activity was monitored in Casp3-Luc-GFP stably expressing HFF (D) and BJ1 (E) cells at different time points post mPOR transduction. Data are presented as mean ± SD, n = 3. F GFP fluorescence showing low (R1) and high (R3) level of caspase-3 activation in the colonies derived from mPOR-transduced Casp3-Luc-GFP stably expressing HFF cells. Scale bar represents 200 μm. Morphologically transformed colonies outgrowth in four subpopulations (R1-R4) of Casp3-Luc-GFP stably expressing HFF (G) and BJ1 (H) cells after mPOR transduction. Data are presented as mean ± SD, n = 2.

