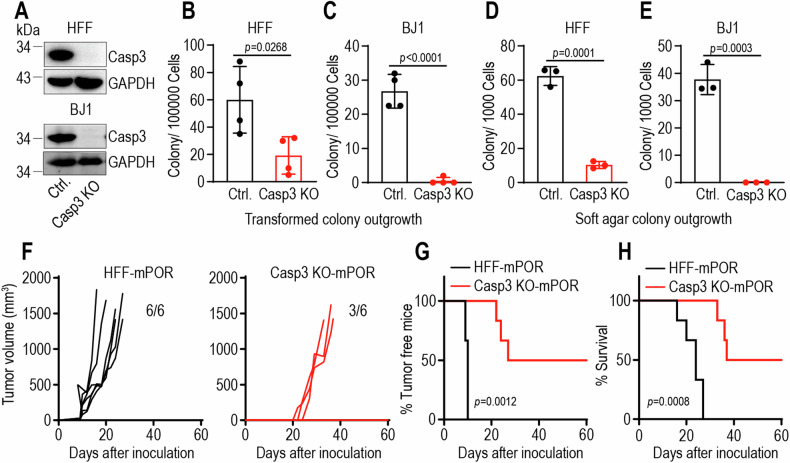
Fig. 2. Caspase-3 deficiency attenuates oncogene-induced malignant transformation.
A Caspase-3 expression in control (Ctrl.) and caspase-3 knockout (Casp3 KO) HFF (upper panel) and BJ1 cells (lower panel). GAPDH was used as protein loading control. The blots for Casp3 and GAPDH were run on the same gel for each cell lines, with blots for BJ1 cells being duplicated. Morphologically transformed colony outgrowth in mPOR-transduced control and Casp3 KO HFF (B) and BJ1 cells (C). Data are presented as mean ± SD, n = 4. p values were determined using Student’s t-test. Soft agar colony growth from transformed control and Casp3 KO HFF (D) and BJ1 (E) cells. Data are presented as mean ± SD, n = 3. p values were determined using Student’s t-test. F Tumor growth curve of 1 × 10⁶ mPOR-transduced HFF cells (HFF-mPOR) and Casp3 KO cells (Casp3 KO-mPOR) subcutaneous injection into female BALB/c nude mice. n = 6 per group. 3 tumor-free mice in Casp3 KO-mPOR group till on day 60. G Kaplan–Meier plot showing the percentage of tumor-free mice in HFF-mPOR and Casp3 KO-mPOR groups. p values were determined by Log-rank t-test. H Kaplan–Meier plot showing the survival rate of HFF-mPOR and Casp3 KO-mPOR groups. p values were determined by Log-rank t-test.

