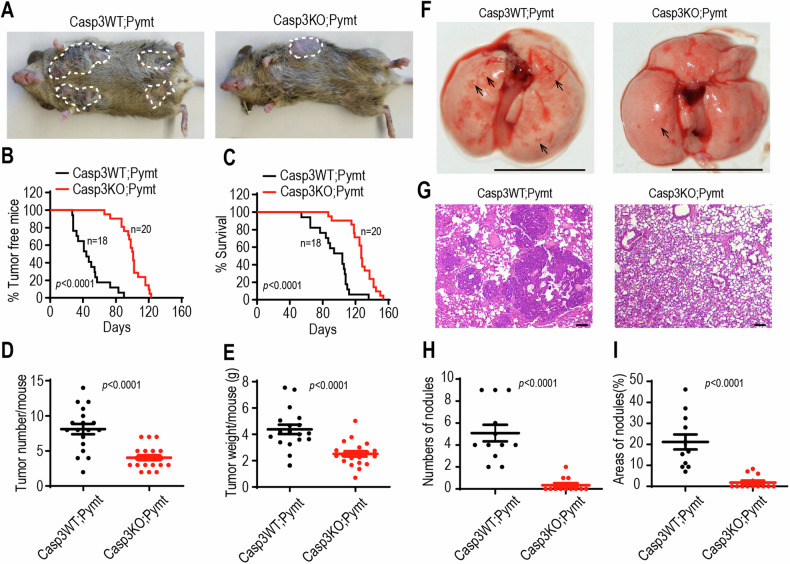
Fig. 3. Caspase-3 depletion delays breast cancer progression in MMTV-PyMT transgenic mice.
A Representative image of wild-type (Casp3WT;Pymt) and Casp3 deficient (Casp3KO;Pymt) virgin female MMTV-PyMT transgenic mice at 13 weeks old, showing grossly visible tumors (demarcated by dotted lines). B Kaplan–Meier plot showing the percentage of tumor-free mice in wild type (Casp3WT;Pymt, n = 18) and Casp3 deficient (Casp3KO;Pymt) virgin female MMTV-PyMT transgenic mice (n = 20). p values were determined by Log-rank t-test. C Kaplan–Meier plot showing the survival rate of wild type (Casp3WT;Pymt) and Casp3 deficient (Casp3KO;Pymt) virgin female MMTV-PyMT transgenic mice. p values were determined by Log-rank t-test. D Number of tumors per mouse in wild type (Casp3WT;Pymt) and Casp3 deficient (Casp3KO;Pymt) MMTV-PyMT transgenic mice at the endpoint. p values were determined using Mann-Whitney U-test. E Weight of tumors per mouse in wild type (Casp3WT;Pymt) and Casp3 deficient (Casp3KO;Pymt) MMTV-PyMT transgenic mice at the endpoint. Data are presented as mean ± SD. p values were determined using Student’s t-test. F Gross photography showing apparent pulmonary metastases in Casp3WT;Pymt mice and Casp3KO;Pymt mice. The black arrow indicates the site of the tumor nodule. The scale bars represent 1 cm. G Representative hematoxylin and eosin staining of lung sections from Casp3WT;Pymt and Casp3KO;Pymt mice. The scale bars represent 100 μm. H The number of metastatic tumor burden in the random fields of lung sections (n = 11 per group). I The percentage of tumor area coverage in each random field of lung sections (n = 11 per group). Data are presented as mean ± SD in (H, I). p values were determined using Mann–Whitney U-test in (H, I).

