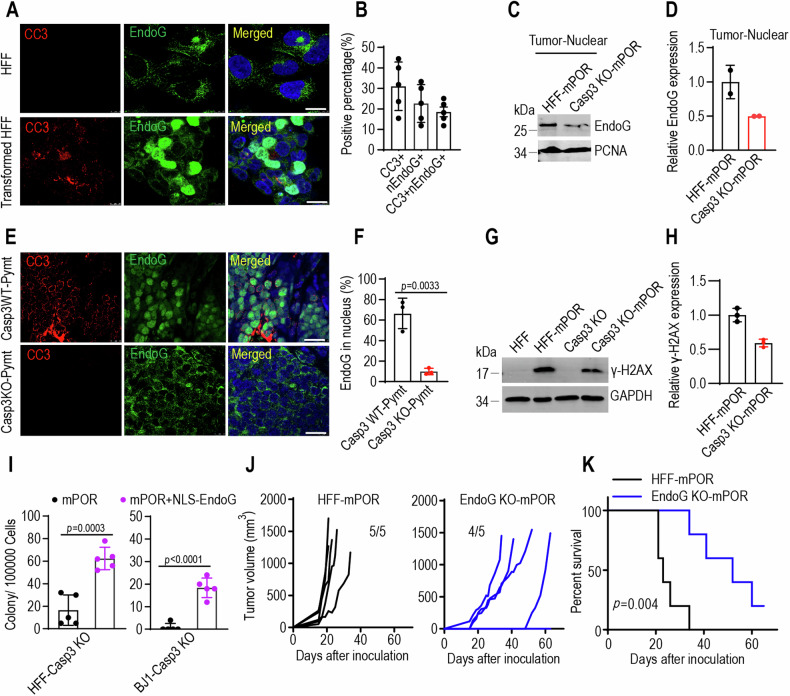
Fig. 4. EndoG translocation in oncogene-induced malignant transformation.
A Immunofluorescence staining image of cleaved caspase-3 (red) and EndoG (green) in parental HFF and mPOR-transduced HFF cells on day 21. The scale bar represents 10 μm. B The positive percentage of cleaved caspase-3 (CC3), nuclear EndoG (nEndoG), and double positive (CC3+nEndoG) in mPOR-transduced HFF cells of (A). Data from five random photography fields. Western blot images (C) and quantification (D) showing low expression of EndoG in the nucleus of caspase-3-deficiency mPOR-derived tumor samples. PCNA was used as nuclear protein loading control. The blots for EndoG and PCNA were run on separate gels, with each blot being duplicated. Immunofluorescence staining image (E) and quantification (F) of cleaved caspase-3 (red) and EndoG (green) in tumor samples from wild type (Casp3WT;Pymt) and Casp3 knockout (Casp3 KO;Pymt) MMTV-PyMT transgenic mice. Scale bar represents 10 μm. Data from three random photography fields. p value was determined using Student’s t-test. Western blot images (G) and quantification (H) showing the activation of H2AX (γ-H2AX) in mPOR-transduced fibroblasts and caspase-3 deficiency fibroblasts. GAPDH was used as protein loading control. The blots for γ-H2AX and GAPDH were run on the same gel, with each blot being triplicated. I Morphologically transformed colonies outgrowth in caspase-3 deficient mPOR-transduced HFF (left panel), BJ1 (right panel) cells in the presence of NLS-EndoG. Data are presented as mean ± SD, n = 5. p values were determined using Student’s t-test. J Tumor growth curve of 1 × 10⁶ mPOR-transduced HFF cells (HFF-mPOR) and EndoG KO cells (EndoG KO-mPOR) subcutaneous injection into female BALB/c nude mice. n = 5 per group. 1 tumor-free mice in EndoG KO-mPOR group till on day 63. K Kaplan–Meier plot showing the survival rate of mPOR-transduced control and EndoG KO HFF cells in female nude mice. p value was determined by Log-rank t-test.

