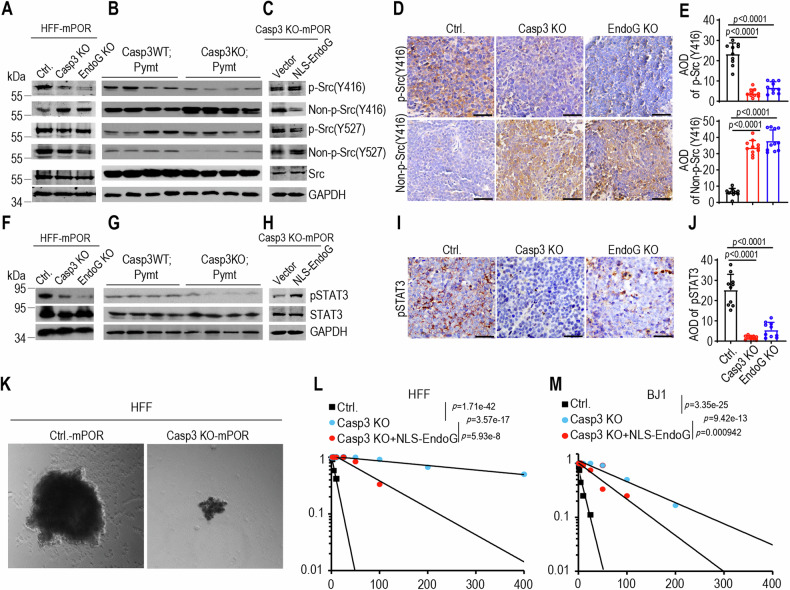
Fig. 5. Caspase-3, and EndoG facilitate oncogenic transformation via Src-STAT3 pathway.
A Western blot analysis of phosphorylation and non-phosphorylation of Src at Y416 and Y527 in control (Ctrl.), Casp3 KO and EndoG KO HFF cells after mPOR oncogene transduction. B Western blot analysis of phosphorylation and non-phosphorylation of Src at Y416 and Y527 in tumor samples from wild type (Casp3WT;Pymt) and Casp3 deficient (Casp3KO;Pymt) MMTV-PyMT transgenic mice. Four tumor samples per group. C Western blot analysis of phosphorylation and non-phosphorylation of Src at Y416 and Y527 in Casp3 KO-mPOR-transduced fibroblasts in the presence of NLS-EndoG. GAPDH was used as protein loading control for (A–C). The blots for the target protein and GAPDH were run on separate gels in each experiment (A–C). IHC staining (D) and quantification (E) of p-Src(Tyr416) and non-p-Src(Tyr416) in mPOR-transformed HFF control (Ctrl.), Casp3 KO or EndoG KO tumors. AOD = the integrated optical density (IOD)/Area of positive staining in IHC staining image. The scale bars represent 50 μm. Data from ten random photography fields; data are presented as mean ± SD. p values were determined using Student’s t-test. F Western blot analysis of phosphorylation of STAT3 (Y705) in control (Ctrl.), Casp3 KO and EndoG KO HFF cells after mPOR oncogene transduction. The blots for pSTAT3 (Y705) and STAT3 were run on separate gels, while blots for pSTAT3 (Y705) and GAPDH were on the same gel. G Western blot analysis of phosphorylation of STAT3 in tumor samples from wild type (Casp3WT;Pymt) and Casp3 deficient (Casp3KO;Pymt) MMTV-PyMT transgenic mice. 4 tumor samples per group. H Western blot analysis of phosphorylation of STAT3 in Casp3 KO-mPOR-transduced fibroblasts reintroduced with nuclear-located modified EndoG. GAPDH was used as protein loading control for (F–H). The blots for the target protein and GAPDH were run on separate gels in each experiment (F–H), with H being duplicated. I and J, IHC staining (I) and quantification (J) of pSTAT3 in mPOR-transformed HFF control (Ctrl.), Casp3 KO or EndoG KO tumors. The scale bars represent 50 μm. Data from ten random photography fields; data are presented as mean ± SD. p values were determined using Student’s t-test. K Representative morphology of tumor spheres of mPOR-transduced HFF control and Casp3 KO cells. Extreme limiting dilution assay evaluation of tumor sphere formation abilities of mPOR-transduced HFF (L) and BJ1 (M) control, as well as Casp3 KO and Casp3 KO with reintroduced NLS-EndoG in both cell lines. p value represents chi-square.

