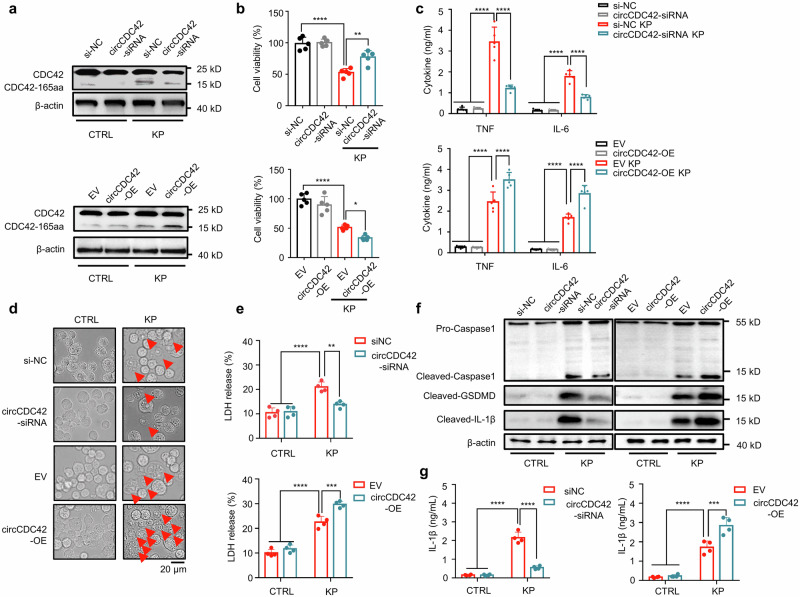
Fig. 3. CDC42-165aa promoted KP-induced MH-S macrophage pyroptosis MH-S cells were transfected with siNC or circCDC42 siRNA, empty vector (EV) or circCDC42 overexpreesion (OE) plasmid, respectively for 24 h. The cells were subsequently infected with KP at an MOI of 20:1 for 4 h.
a The expression of CDC42 and CDC42-165aa in the indicated MH-S was detected by immunoblotting (n = 3 biological replicates). b Results of the MTT assay showing the viability of MH-S cells (n = 5 biological replicates). c The ELISA results indicating the levels of TNF and IL-6 in the MH-S cell supernatants (n = 5 biological replicates). d Light microscopy analysis of the morphology of MH-S cells treated as indicated, the red arrows indicate pyroptotic cells (n = 3 biological replicates). Scale bar, 20 μm. e The release of LDH from MH-S cells was treated as indicated and presented as a percent of medium activity compared to cell lysate from cells (n = 4 biological replicates). f Immunoblotting analysis of the expression of Caspase-1, GSDMD and IL-1β in the indicated MH-S cells (n = 3 biological replicates). g The secretion of IL-1β in the indicated MH-S cell supernatants was detected by ELISA (n = 4 biological replicates). Data are presented as the means ± SD. b One-way ANOVA with Tukey test. c, e, g Two-way ANOVA with Bonferroni’s test. *p < 0.05; **p < 0.01; ***p < 0.001; ****p < 0.0001. p-values: (b) p = 1.86E-06 (siNC vs siNC + KP), p = 1.26E-06 (siNC + KP vs si-circCDC42 + KP), p = 2.92E-06 (EV vs EV + KP), p = 5.23E-05 (EV + KP vs OE + KP). (c) TNF: p = 1.23E-10 (siNC vs siNC + KP), p = 3.15E-10 (siNC + KP vs si-circCDC42 + KP), p = 5.54E-09 (EV vs EV + KP), p = 8.96E-05 (EV + KP vs OE + KP); IL-6: p = 5.44E-10 (siNC vs siNC + KP), p = 1.50E-05 (siNC + KP vs si-circCDC42 + KP), p = 9.21E-07 (EV vs EV + KP), p = 3.08E-05 (EV + KP vs OE + KP). (e) p = 4.63E-06 (siNC vs siNC + KP), p = 0.0011 (siNC + KP vs si-circCDC42 + KP), p = 2.29E-07 (EV vs EV + KP), p = 0.0004 (EV + KP vs OE + KP). (g) p = 6.01E-10 (siNC vs siNC + KP), p = 0.0011 (siNC + KP vs si-circCDC42 + KP), p = 1.95E-05 (EV vs EV + KP), p = 0.0004 (EV + KP vs OE + KP). See also Figure S3. Source data are provided as a Source data file.

