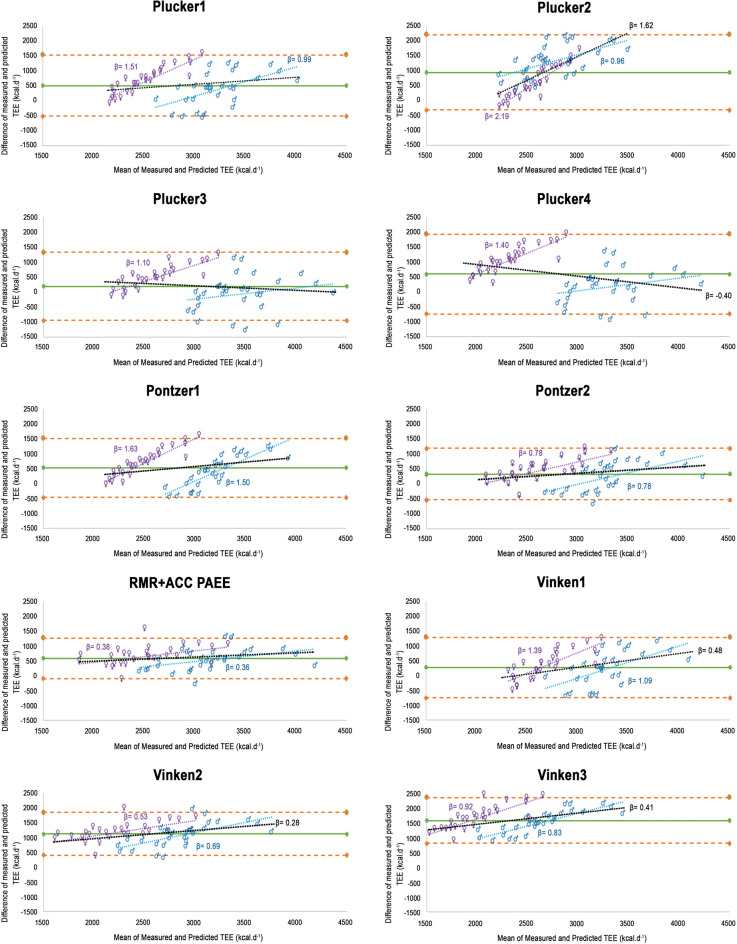
Figure 1.
Bland–Altman plots for measured and predicted TEE applied to the whole sample (n = 56). Purple (♀ = females), blue (♂ = males), and black (both sexes) dotted lines represent the relationship between the magnitude of the TEE and the extent of error of the predictive equations by sex (homoscedasticity or heteroscedasticity). When β (slope of the line) is shown, heteroscedasticity is significant (p-value < .01). Green solid line shows the mean difference between measured and predicted TEE for each model. Orange dashed lines show the limits of agreement (Bias ± 1.96*Standard Deviation).

