
Figure 2.
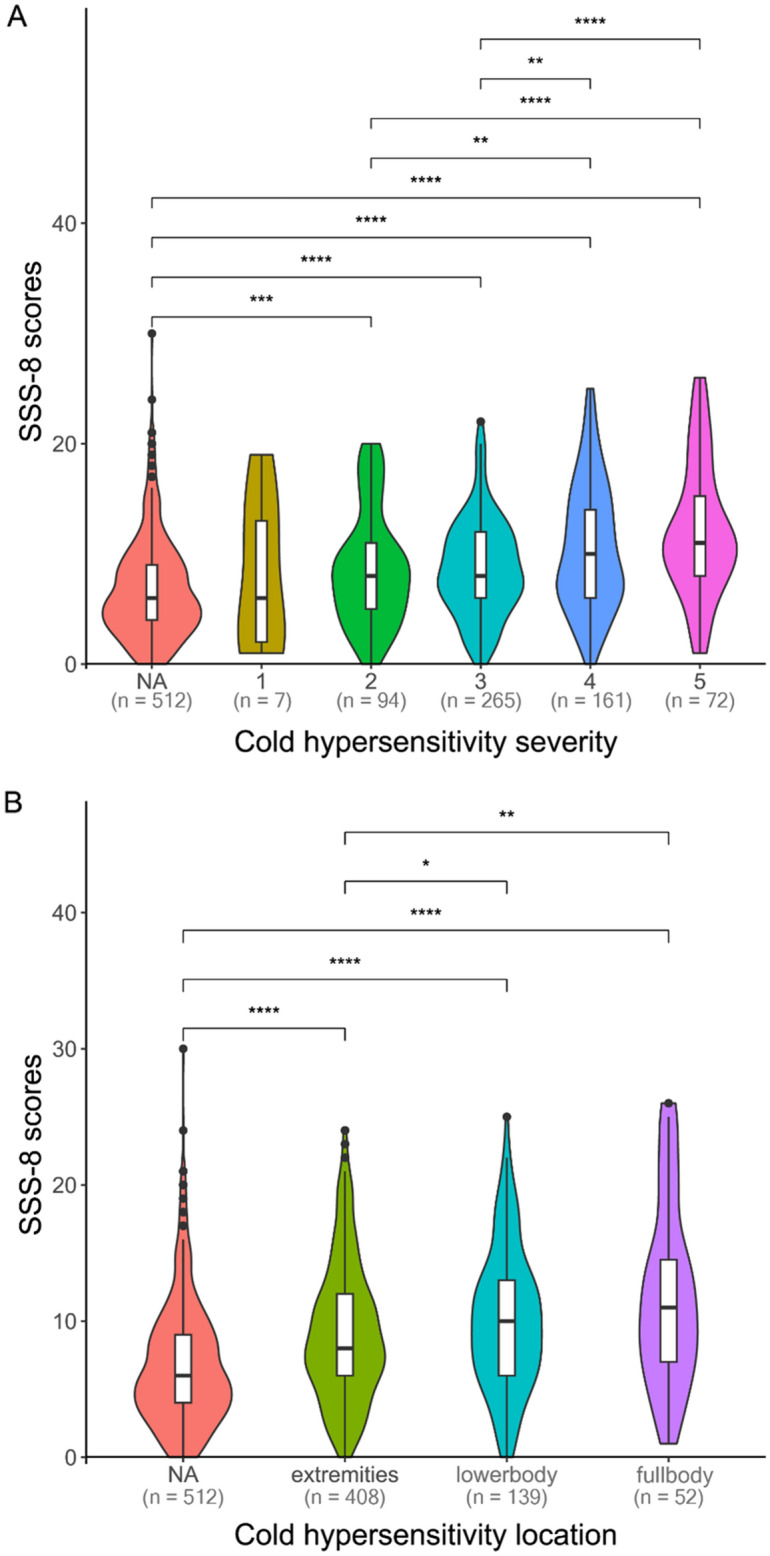
Associations of the somatic symptom scale-8 (SSS-8) scores with (A) cold hypersensitivity severity and (B) location. The x-axis in (A) represents severity, with values ranging from 1 (not at all) to 5 (very much). NA not applicable for cold hypersensitivity severity or location, i.e., the population with normal cold sensitivity status (n = 512). P values for pairwise differences between groups were calculated using the Holm–Bonferroni method. .