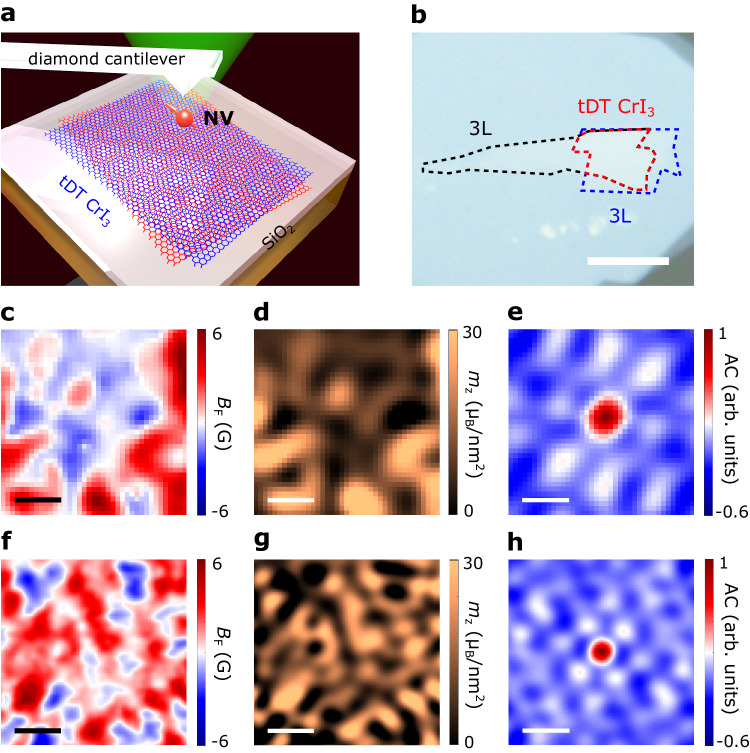
Fig. 2. Scanning single-spin magnetometry measurements of small-twist-angle tDT CrI3.
a Schematic illustration of scanning NV measurements of twisted CrI3. b Optical microscope image of a small-twist-angle tDT CrI3 sample. The two torn trilayer CrI3 flakes are outlined by the black and blue dashed lines, respectively, and the twisted area is highlighted by the red dashed lines. Scale bar is 10 μm. c, f Nanoscale scanning NV imaging of magnetic stray fields emanating from selected sample areas of a 0.15° tDT CrI3 (c) and a 0.25° tDT CrI3 device (f). d, g Magnetization maps reconstructed from the stray field patterns shown in c and f for the 0.15° tDT CrI3 (d) and 0.25° tDT CrI3 (g) sample. e, h Normalized autocorrelation (AC) maps of the stray field patterns shown in c and f for the 0.15° tDT CrI3 (e) and 0.25° tDT CrI3 device (h). Scale bar is 200 nm for images presented from c to h.

