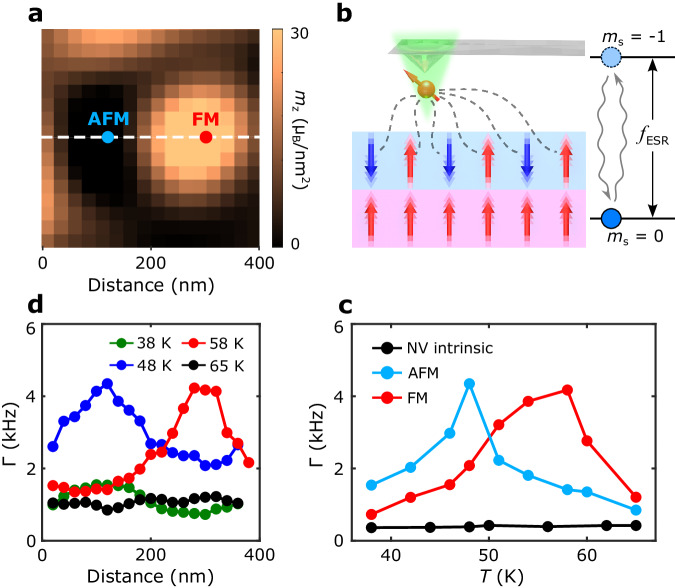
Fig. 3. NV spin relaxometry measurements of spin fluctuations in 0.15° tDT CrI3.
a Zoomed-in view of a magnetization map measured on a selected sample area (400 nm 400 nm) of the 0.15° tDT CrI3 device, showing co-existing FM and AFM domains. b Schematic of NV spin relaxometry measurements to probe spin fluctuations of local FM and AFM states in a proximal sample. The blue and red arrows represent local magnetic moments forming spontaneous AFM and FM orders. Noncoherent magnetic noise arising from FM or AFM spin fluctuations at the NV ESR frequencies fESR will drive NV spin transitions from the ms = 0 to the ms = 1 state, resulting in enhanced NV relaxation rate. c Temperature dependence of NV spin relaxation rate measured when the NV center is positioned right above the FM and AFM domains formed in the 0.15° tDT CrI3 sample. Control measurement results are also presented to characterize the intrinsic NV spin relaxation rate. d 1D NV spin relaxation rate measured along the white dashed lines across the co-existing FM and AFM domains in the 0.15° tDT CrI3 device shown in Fig. 3a. The peak values of measured at 48 K and 58 K occur at the corresponding in-plane lateral positions of AFM and FM domains, respectively.

