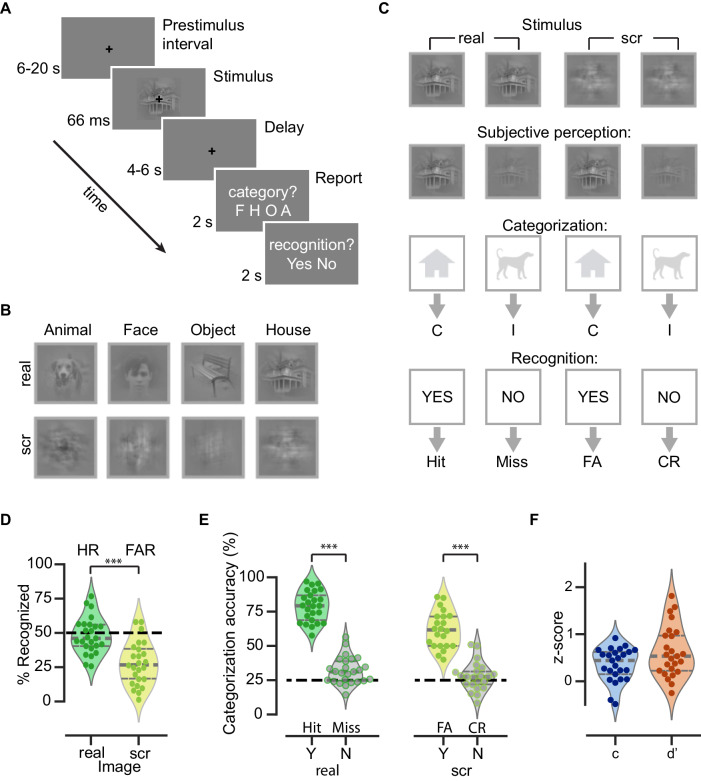
Fig. 1. Experimental paradigm and behavioral results.
A Trial structure of the main object recognition task. B Example real and scrambled (scr) images from each category. C Schematic of trial types and their classification into behavioral metrics. C correct, I incorrect, FA false alarm, CR correct rejection. Categorization responses for scrambled images are coded as correct or incorrect according to the category that the scrambled image was generated from. D Percentage of real and scrambled image trials reported as recognized, which are equivalent to hit rate (HR) and false alarm rate (FAR), respectively (n = 25, two-sided Wilcoxon signed-rank test, ***W = 315, p = 4.1 × 10⁻⁵). The black dashed line indicates threshold-level recognition rate (50%). E Left: Categorization accuracy for real images grouped by recognition outcome (yes vs no), which are equivalent to hits and misses (two-sided Wilcoxon signed-rank test: ***W = 325, p = 1.2 × 10⁻⁵). Right: Categorization accuracy for scrambled images grouped by recognition outcome (yes vs no), which are equivalent to false alarms and correct rejections (two-sided Wilcoxon signed-rank test: W = 231, ***p = 5.96 × 10⁻⁵). For scrambled images, the categorization accuracy was calculated based on the category of the real image from which the scrambled image was created. The black dashed line indicates chance-level accuracy (25%). F Criterion (c) and sensitivity (d’) based on the recognition reports (HR and FAR). A–C Due to copyright limitations, the exact stimuli used in the experiment are not shown in the figure. The face, house, object, and animal images presented here are similar examples obtained from http://www.pexels.com. D–F Violin plots display the shapes of estimated density probability distributions. The gray, horizontal lines indicate the 25th percentile, median, and 75th percentile. Each circle represents an individual subject.

