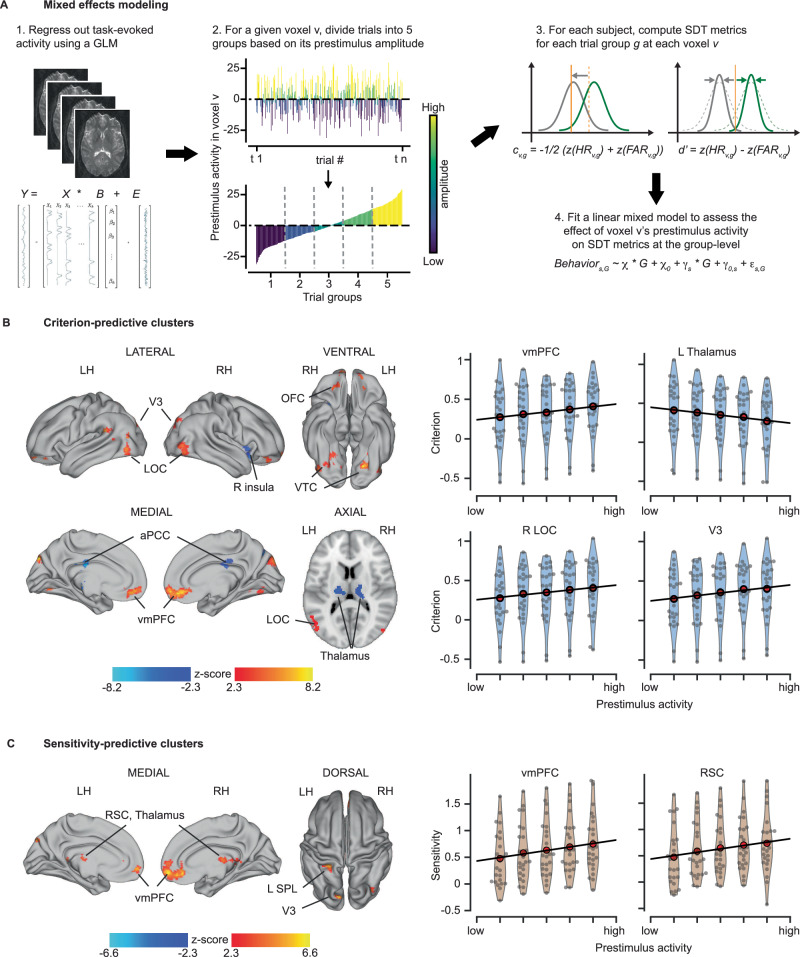
Fig. 2. Prestimulus activity influencing the criterion and sensitivity of recognition, respectively.
A Schematic for linear mixed-effect models (LMM) assessing recognition behavior as a function of prestimulus activity. See methods for details. B Left: Whole brain statistical maps of prestimulus activity’s influence on criterion. Statistically significant positive and negative clusters are shown in warm and cool colors, respectively (n = 25, LMM, thresholded at p < 0.05, family-wise error (type I, FWE) corrected for cluster size, with a cluster-defining threshold (CDT) of p < 0.01). Right: Criterion as a function of the prestimulus activity across voxels within selected brain regions from the left panel. Red circles represent the mean criterion across subjects at each prestimulus activity level. Gray circles represent individual subjects. Blue shapes depict the density estimates of the distributions. The predicted fit of criterion (black line) was estimated based on the mean prestimulus activity across voxels within the ROI using an LMM. C Same as B, but for sensitivity (d’)-predictive prestimulus activity. aPCC anterior portion of posterior cingulate cortex, LOC lateral occipital cortex, vmPFC ventromedial prefrontal cortex, OFC orbitofrontal cortex, RSC retrosplenial cortex, SPL superior parietal lobule, VTC ventral temporal cortex. LH/RH left/right hemisphere.

