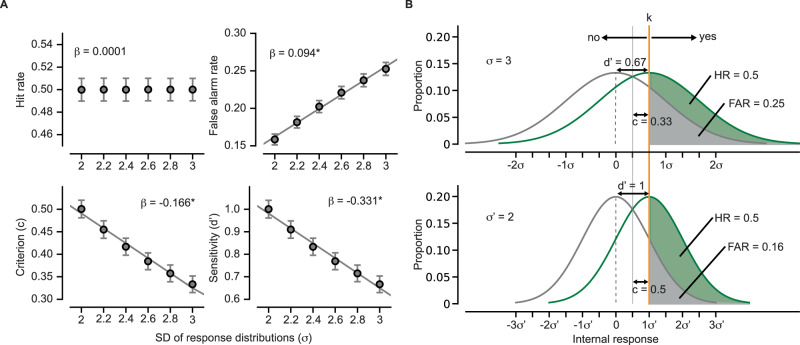
Fig. 4. Inferring behavioral consequences of reduced response variability using simulation.
A Predicted fit of perceptual behavior metrics based on the standard deviation (σ) of target and non-target response distributions of the simulated data (n = 10,000 simulated observers). The circles and error bars indicate the mean and standard deviation across the simulated observers at each σ level. The predicted fits were estimated using linear regressions. Hit rate: β = 0.0001, p = 0.266; False alarm rate: β = 0.094, p < 0.001; Criterion (c): β = –0.166, p < 0.001; Sensitivity (d’): β = –0.331, p < 0.001. Asterisks denote statistical significance at p < 0.05 after FDR correction for multiple comparisons. * denotes statistical significance at p < 0.05, FDR correction for multiple comparisons. B Changes in behavioral metrics with a decrease in response variability from σ = 3 (top) to σ’ = 2 (bottom). The curves outlined in green and gray colors represent the distributions of internal responses to target and nontargets, respectively. The orange vertical line indicates the decision boundary (k), which separates the yes and no reports. The green shaded area represents HR, which remains unchanged across different σ levels. In contrast, FAR, which is displayed by the gray shaded area, decreases with decreasing σ. Both criterion (c) and sensitivity (d’) are measured in the standard deviation (z-score) units (see Methods). c reflects the distance between the decision boundary (k) and the point of intersection between the target and nontarget distributions (solid gray line). d’ reflects the distance between the means of target and nontarget distributions.

