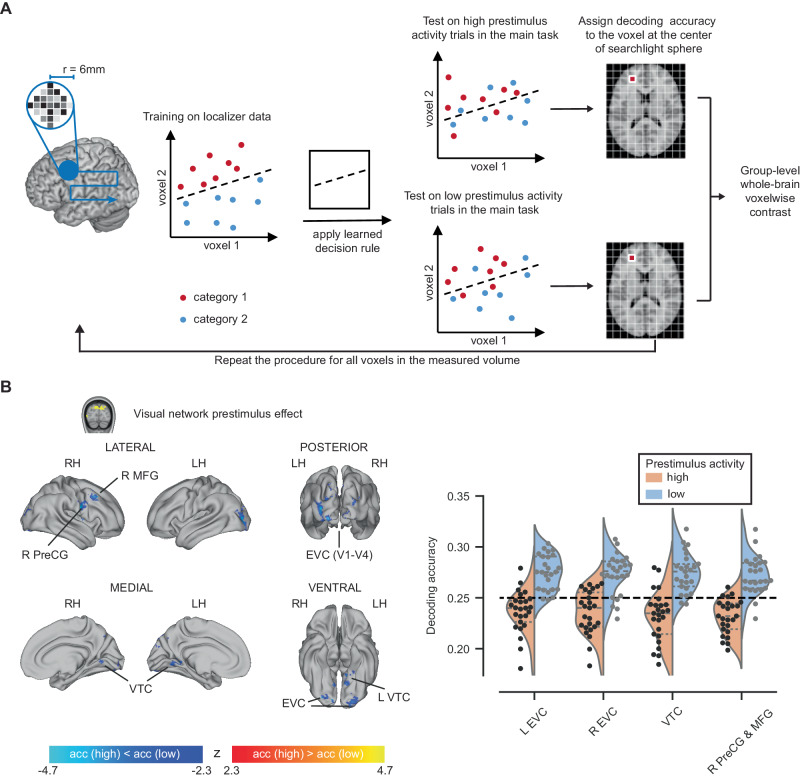
Fig. 5. Prestimulus activity’s influence on image category encoding.
A Schematic for searchlight decoding. The decoder was fit using data from an object category localizer wherein the object images were presented at high contrast. The decoder was tested using stimulus-triggered responses in the main task (objects presented at a liminal contrast), where the trials were split in two groups based on prestimulus activity amplitude of the investigated ROI. r radius. B Left: Whole-brain statistical maps for differences in decoding accuracy between trials preceded by high vs low prestimulus activity in the visual network ROI. Voxel clusters with significantly higher decoding accuracies in high prestimulus activity trials are shown in warm colors, while clusters with higher decoding accuracies in low prestimulus trials are displayed in cool colors. (n = 25, two-sided t-tests, thresholded at p < 0.05, FWE corrected for cluster size, CDT at p < 0.01). Right: Mean decoding accuracy across voxels in each identified cluster when prestimulus visual network activity was high vs. low. Each circle represents one subject. The orange and blue shapes in the background represent the estimated density distributions of the mean decoding accuracies. EVC early visual cortex, MFG middle frontal gyrus, MTG middle temporal gyrus, PreCG precentral gyrus, VTC ventral temporal cortex. L left, R right. LH left hemisphere, RH right hemisphere, acc accuracy.

