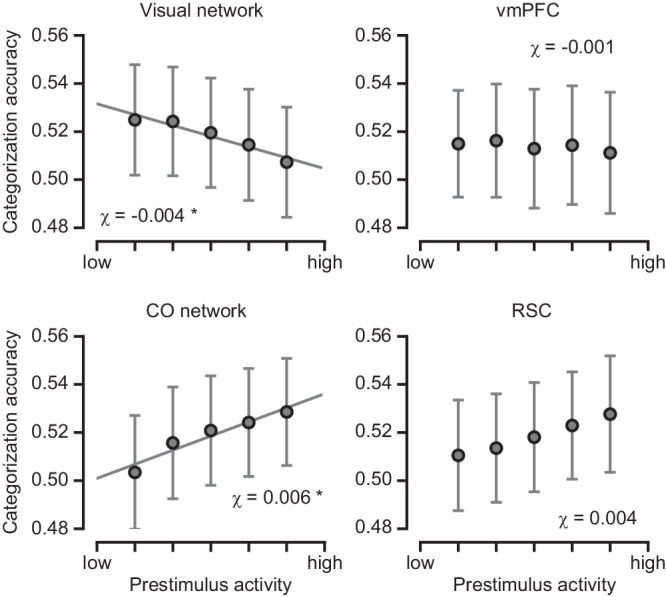
Fig. 6. The effect of prestimulus brain activity on categorization behavior.

Categorization accuracy plotted as a function of the mean prestimulus activity in the visual network, vmPFC, CO network, and RSC, respectively. The displayed data points represent the mean categorization accuracy across participants for trial groups sorted according to the prestimulus activity of each ROI. The error bars denote SEM. The predicted fit of categorization accuracy was estimated using linear mixed-effects models. Visual network: = –0.004, p = 0.006; vmPFC: = –0.001, p = 0.58; CO network: = 0.006, p = 0.002; RSC: = 0.004, p = 0.05. *denotes statistical significance at p < 0.05 after FDR correction for multiple comparisons.
