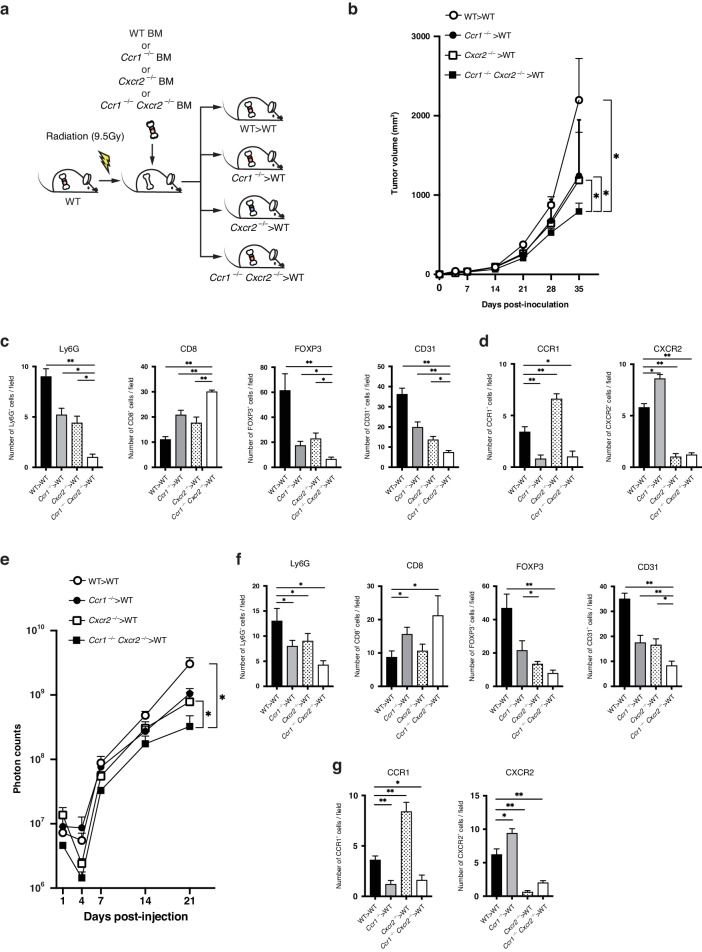
Fig. 6. Lack of both CCR1 and CXCR2 in hematopoietic myeloid cells dramatically suppresses CRC tumor growth and metastasis.
a Scheme of BM transfer experiments. Wild-type recipient hosts were sub-lethally irradiated and then reconstituted with wild-type BM (WT > WT mice), Ccr1−/− BM (Ccr1−/− > WT mice), Cxcr2−/− BM (Cxcr2−/− > WT mice) or Ccr1−/−Cxcr2−/− BM (Ccr1−/−Cxcr2−/− > WT mice). b Tumor growth curves of transplanted MC38 tumors in WT > WT mice, Ccr1−/− > WT mice, Cxcr2−/− > WT mice and Ccr1−/−Cxcr2−/− > WT mice. Bars, mean ± SEM (Student’s t test; *P < 0.05). n = 5 mice for each group. c Immunohistological staining for Ly6G+ neutrophils, CD8+ T cells, FOXP3+ Treg cells and CD31+ endothelial cells around transplanted MC38 tumors. *P < 0.05 and **P < 0.01 by Student’s t test. d Immunohistological staining for CCR1+ and CXCR2+ cells. *P < 0.05 and **P < 0.01 by Student’s t test. e Quantification of liver metastatic lesions (photon counts). Bars, mean ± SEM (Mann–Whitney U test; *P < 0.05). n = 3–6 mice for each group. f Immunohistological staining for Ly6G+ neutrophils, CD8+ T cells, FOXP3+ Treg cells and CD31+ endothelial cells around MC38 liver metastases. *P < 0.05 and **P < 0.01 by Student’s t test. g Immunohistological staining for CCR1+ and CXCR2+ cells. *P < 0.05 and **P < 0.01 by Student’s t test.

