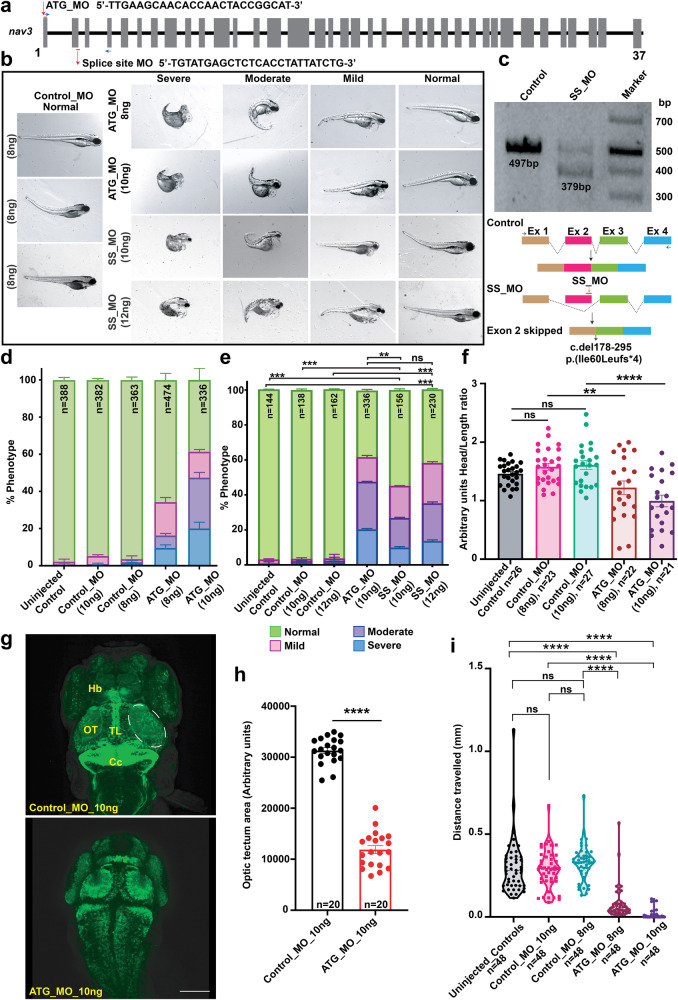
Fig. 5. Zebrafish nav3 morphants show severe development abnormalities.
a Schematic representation of zebrafish nav3 gene along with position and sequence of ATG translational blocker (ATG_MO) and splice site (SS_MO) morpholinos. b Representative images of control (Control_MO), nav3 ATG_MO (10 ng), and SS_MO (12 ng) morphants. Based on their developmental morphology, nav3 morphants were grouped into severe, moderate, mild, and normal classes. Severe class morphants had underdeveloped heads and eyes, small body length, missing swim bladders, yolk and heart edema, and curved tails, while moderate class morphants had small head size, yolk, and heart edema with curved tail in morphants. The mild class morphants had small head sizes, yolk, and heart edema, while normal class morphants had no apparent morphological difference from WT or control injected larvae. c RT-PCR followed by gel electrophoresis revealed smaller PCR product in SS_MO injected morphants (top). Sanger sequencing of the PCR products confirmed aberrant splicing (exon 2 skipping, deletion of 118 bp; schematically represented in bottom panel) due to the SS_MO injection in zebrafish larvae. d, e Phenotype assessment-based bar graphs for control, nav3 ATG_MO, SS_MOs. d With increase in ATG_MO concentration, the phenotypic abnormalities among injected larvae also escalated. e Compared to control, significantly reduced (**p < 0.0048 and ****p < 0.000123) number of morphologically normal larvae observed in ATG_ and SS_MOs injected morphants. f Head-to-length ratio bar graph in uninjected, control_MO, and nav3 ATG_MO morphants. Compared to controls, nav3 morphants have statistically significant reduced head sizes (**p = 0.006931 and ****p = 0.000027, respectively), suggesting microcephaly. g Confocal images of zebrafish brain from the neuro-d transgenic line, injected with control (top) or nav3 (bottom) morpholinos. Control_MO injected larvae show normal morphology of optic tectum (OT), torus longitudinalis (TL), habenula (Hb), and corpus cerebelli (Cc) regions. In contrast, nav3 morphants had significantly reduced (****p < 0.000001) OT (highlighted with white dashed lines), quantified in (h). Scale bar: 100 um. i Violin plot showing statistically significant (****p < 0.000001) decreased movement in nav3 morphants as compared to controls, when subjected to light stimulus. Error bars in (d, e, f, h, I), represent standard error of the mean.

