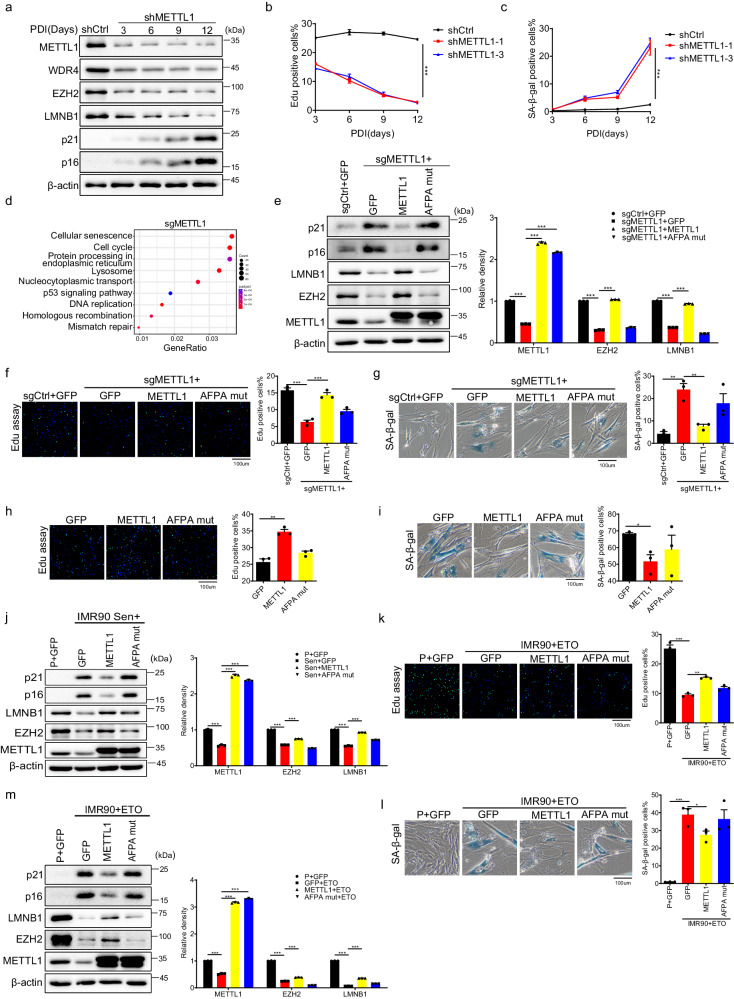
Fig. 2. METTL1 regulates senescence.
a Western blotting detected senescence markers at various time points following transduction with METTL1 and control shRNA. A representative experiment was presented, three repeats demonstrate similar results. b EdU incorporation assays(b) and Senescence-associated β-galactosidase (SA-β-gal) (c) staining were conducted on control and METTL1 knockdown cells at various time points after transduction with METTL1 and control shRNA. Scale bar = 100 μm. d KEGG analysis was conducted on the transcriptome from METTL1-depleted cells (KO). e Senescence-associated proteins were analyzed in METTL1 knockout cells introduced with different proteins. A representative experiment was presented, three repeats demonstrate similar results. The EdU incorporation assay (f, h) and SA-β-gal staining (g, i) was performed on METTL1 KO IMR90 cells or wildtype IMR90 cells introduced with indicated proteins. Scale bar = 100 μm. j Western blotting for senescence markers was conducted on IMR90 cells transduced with GFP control, METTL1, and AFPA-mutant. P + GFP means proliferating cells with GFP overexpression. Three repeats demonstrate similar results. The representative experiment was shown, band intensity was quantified by image j for three time. ETO treated IMR90 cells expressing METTL1 or AFPA-mutant was assessed by EdU incorporation (k), SA-β-gal staining(l), and western blotting(m), P + GFP refers to IMR90 cells with GFP overexpression. Scale bar = 100 μm. All the assays were biologically repeated three times. All data were presented as the mean ± SEM. P values in panel (b, c) were calculated by two-tailed unpaired t test, P values in panel (e–m) were calculated by one-way ANOVA with Bonferroni’s multiple comparisons test. *p < 0.05; **p < 0.01; ***p < 0.001. Source data are provided as a Source Data file.

