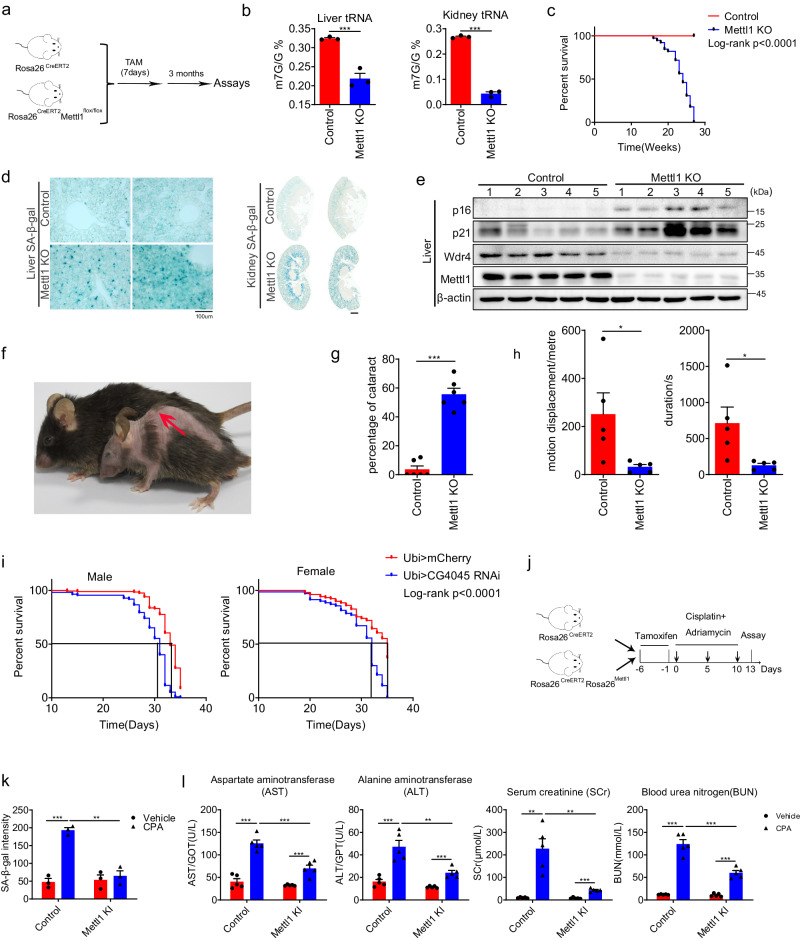
Fig. 3. Depletion of Mettl1 induces premature aging.
a Schematic of the experiment for conditional knockout of Mettl1.b m7G modifications of tRNA from Mettl1 KO mice(2 female and 1 male) and control mice(2 female and 1 male) were detected using HPLC/MS. c Kaplan-Meier curves were generated for Mettl1 knockout (KO) and control mice. Control group: n = 44(24 female and 20 male); cKO group: n = 39(22 female and 17male mice). P < 0.0001. d Senescent cells in Mettl1 knockout (KO) liver and kidney tissues was assessed using SA-β-gal staining, one female and one male mouse in each group were used in the staining. Scale bar = 100 μm. e p16 and p21 were detected using Western blotting in liver tissue from control and knockout (KO) mice, five mice were used to isolate protein (n = 5,3 female and 2 male). f Representative photos of Mettl1 knockout and control mice around 6 months old were shown. The arrow points to postural kyphosis. g The percentage of mice with cataracts was calculated. Six biologically repeats were conducted, n = 35(20 female and 15 male). h Muscle performance was tested using a treadmill exhaustion assay in control and Mettl1 knockout (KO) mice (n = 5 for each group, 3 female and 2 male). i The survival assay results of Drosophila depleted of CG4045 using UAS-GAL4 were presented. (male = 315; female = 278). j Schematic diagram for cisplatin and adriamycin (CPA)-induced chemotherapy senescence. k Liver sections from the CPA model were subjected to SA-β-gal staining, n = 3(2 female and 1 male). l Aspartate aminotransferase (AST), alanine aminotransferase (ALT), serum creatinine (SCr), and urea nitrogen (BUN) levels were measured for the CPA model, 5 male mice per group were used(3 female and 2 male). Unless otherwise indicated, all the assays were biologically repeated for three times, all data were presented as the mean ± SEM. P values were calculated by two-tailed unpaired t test (b, g, h), two-way ANOVA with Bonferroni’s multiple comparisons test(k,l). *p < 0.05; **p < 0.01;***p < 0.001. Source data are provided as a Source Data file.

