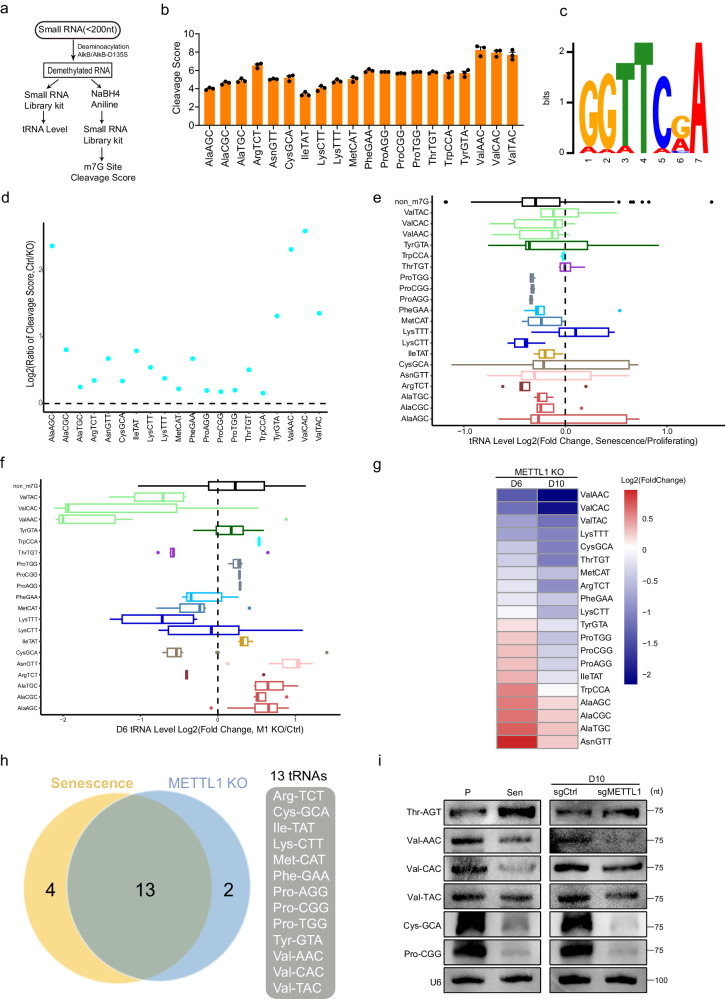
Fig. 4. METTL1 deficiency downregulates a group of m7G-tRNAs.
a Schematic diagram for TRAC-Seq experiment used to define m7G modification and assess tRNA levels. b Cleavage scores calculated from TRAC-Seq for tRNAs in IMR90 cells were exhibited. TRAC-Seq data were collected from three independent experiments. c Motifs for m7G methylation sites were summarized from TRAC-Seq data. d Cleavage scores ratios in sgRNA scramble control and METTL1 knockout (KO) cells were characterized. Cleavage Score Ratio = Cleavage Score of Control/Cleavage Score of Knockout. e Differentially expressed m7G-tRNAs were observed in proliferating and senescent cells. Each boxplot represents the expression of a tRNA type that was calculated from the combined expression of all the tRNA genes belonging to the same tRNA type. f Differentially expressed m7G-tRNAs in control/METTL1 KO (Day 6) cells were observed. All tRNA genes of the same tRNA type were combined to calculate their transcript abundance. g Fold change in m7G-tRNA transcript abundance was presented for METTL1 KO compared to Ctrl. D6 and D10 mean 6 and 10 days after sgRNAs transduction, respectively. h Venn diagram showed the thirteen tRNAs regulated by METTL1 and senescence. The list was based on alterations in tRNA levels and m7G abundance in proliferating/senescent IMR90 cells and control/METTL1 KO cells. i Northern blotting was performed for tRNAs using the specified samples. The representative experiment was shown, three repeats demonstrate similar results. Source data are provided as a Source Data file.

