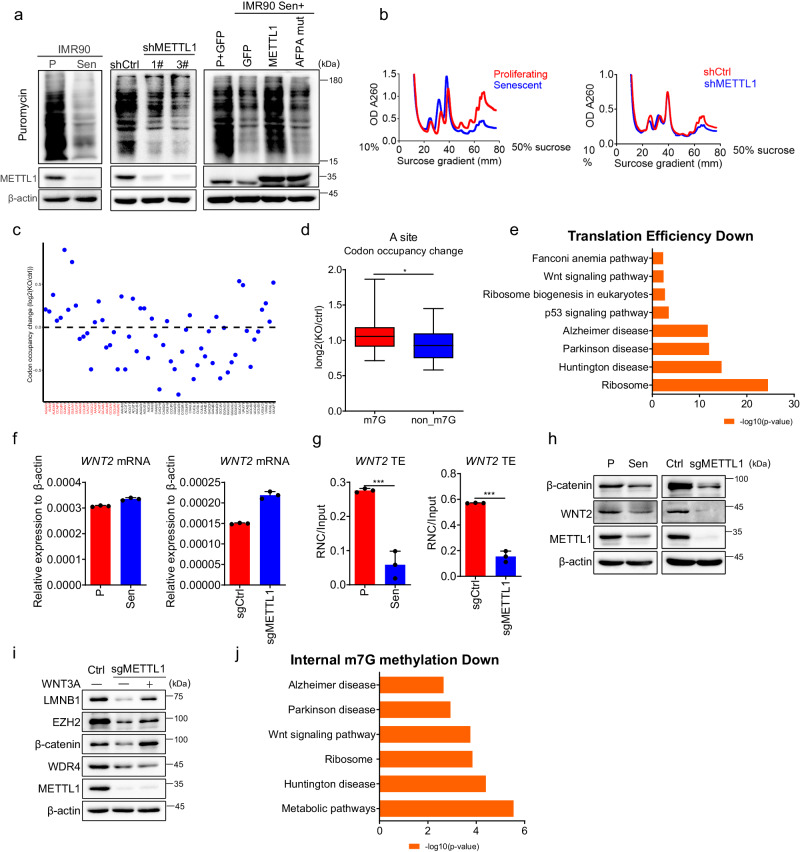
Fig. 5. Ribo-seq uncovers ribosome stalling in METTL1-deficient cells.
a Puromycin incorporation assay was performed in young and senescent cells, scramble control and METTL1 knockdown (KD) cells, and cells with ectopic expression of GFP, METTL1, and AFPA mutant. b Polysome profiling was conducted for senescent cells, METTL1 KD cells, and their corresponding control cells. c Ribosome occupancy at individual codons in the A site. Plots represent the relative ribosome footprinting signals from sgRNA and scramble control cells. Two replicates were performed. The codons are separated into m7G-tRNA decoding codons(red) and non-m7G-tRNA decoding codons(black). d Mann–Whitney U test on the ribosome occupancy at individual codons in A site from m7G-tRNA and non-m7G-tRNA. The ribosome footprinting signals from sgRNA and control samples were analyzed. The boxplot showing the mean, standard deviation (std), and median for each tRNA type. The upper and lower limits and the center line represent the 75th and 25th percentiles and the median, respectively; upper and lower whiskers indicate ±1.5× the interquartile range. *p < 0.05. e Bar plots show the enriched KEGG terms of decreased TE genes detected by Ribo-Seq upon METTL1 knockout. Two-sided Fisher’s exact test was used without adjusting for multiple comparisons in this analysis. f mRNA levels of WNT2 were detected in senescent IMR90 cells and METTL1-deficient cells using RT-qPCR. g The translation efficiency of WNT2 for senescent IMR90 cells and METTL1 KO cells was measured by RT-qPCR using RNC-mRNAs. h WNT2 protein was detected by Western blotting in METTL1 KO IMR90 cells and senescent IMR90 cells. i Senescence-associated markers were detected by Western blotting in METTL1 KO IMR90 cells with or without Wnt3a-conditioned medium. j Bar plots show the enriched KEGG terms of genes with reduced internal m7G methylation levels, as detected by MeRIP, and decreased translation efficiency (TE). KEGG analysis for the shared mRNAs are presented. The representative result was presented, three repeats demonstrate similar results (a, b, h, i); Three repeats were performed for qPCR assay. f, g. All data were presented as the mean ± SEM. Two-tailed unpaired t test (f, g). *p < 0.05, **p < 0.01, ***p < 0.001. Source data are provided as a Source Data file.

