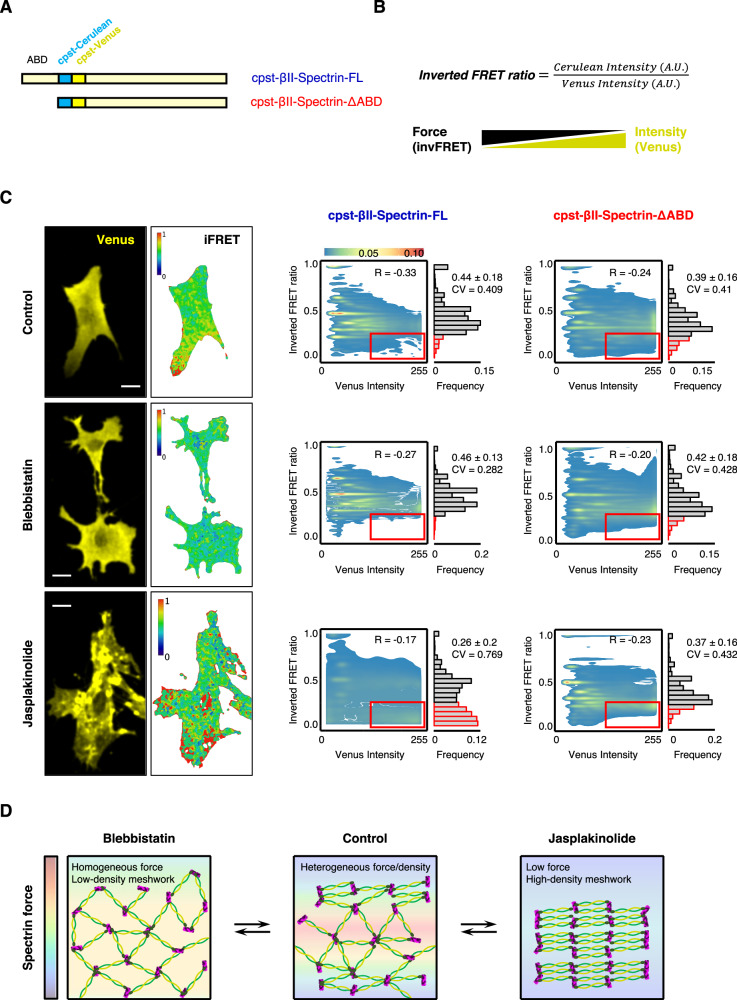
Fig. 5. Spectrin displays a low tensional state in clusters.
A Schematic representation of the βII-spectrin FRET-based tension sensor. ∆ABD (red) lacks the actin-binding domain, while the FRET pair (cpst-Cerulean and cpst-Venus) is inserted between the Actin Binding Domain and the central rod in the full-length counterpart (FL, blue). B InvFRET is calculated according to Meng and Sachs (2012): higher ratio reflects a higher tensional state (lower FRET) and vice versa, the expected relationship between tension and fluorescence intensity of the acceptor is also reported. C Representative FRET images are shown (scale bar 20 μm). Pixel-by-pixel analysis was performed in at least n = 90 cells per condition, and scatter plots show the local relationship between the invFRET and Venus intensity. Contours of 2D Kernel densities are reported with the corresponding calibration bar, Pearson’s correlation coefficients as well as coefficient of Variation (CV, defined as the ratio of the standard deviation to the mean) are also reported. The frequency distribution of the invFRET highlights the peculiar behavior of the FL βII-spectrin FRET-based tension sensor upon Jasplakinolide treatment, which displayed a unique bimodal distribution with the appearance of low invFRET values in correspondence of high-intensity Venus (highlighted by the red box). The same was not observed in any other experimental conditions. Mean ± SD values are reported. D Cartoon representation of the differential configurations of the spectrin mesh upon drug perturbations, and the relationship with tension.

