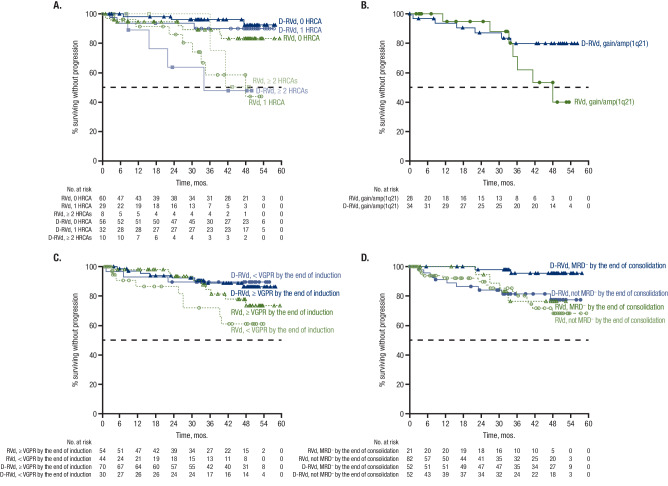
Fig. 5. Subgroup analysis of PFS.
PFS is shown A by NDMM disease with 0, 1, or ≥ 2 HRCAsa, B among patients with gain/amp(1q21)b, C by VGPR status by the end of induction, and D by MRD status (10−5) by the end of consolidation. Results of the Kaplan–Meier estimates of PFS among clinically relevant subgroups of patients are shown and were evaluated at the time of the final analysis (median follow-up, 49.6 months). PFS progression-free survival, VGPR very good partial response, MRD minimal residual disease, NDMM newly diagnosed multiple myeloma, HRCA high-risk cytogenetic abnormality, D-RVd daratumumab plus lenalidomide/bortezomib/dexamethasone, RVd lenalidomide/bortezomib/dexamethasone, FISH fluorescence in situ hybridization. aHRCA groups are based on FISH testing as the absence (0 HRCA) or presence of ≥ 1 of the following: del(17p), t(4;14), t(14;16), t(14;20), or gain/amp(1q21) (≥ 3 copies of chromosome 1q21). bPatients in this group have gain/amp(1q21) with or without other HRCAs (del[17p], t[4;14], t[14;16], or t[14;20]).

