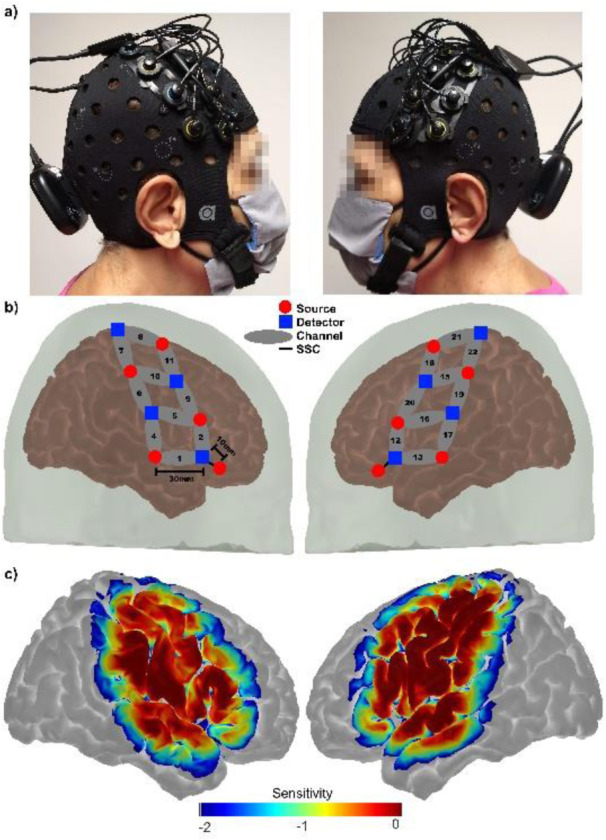
Figure 2. Figure 2: a) Pictures showing the location of an optode array on a single participant's skull. b) Registered probe geometry: the eight detectors are designated by blue squares, while the ten sources are indicated by red circles. Long separation channels (30 mm) are indicated by black numerals in gray ellipses, and short separation channels (SSC = 10 mm) are indicated by black lines, c) a logarithmic temperature plot representing the probe's sensitivity to detect brain hemodynamics goes from 1.00 (0 dB, red) to 0.01 (-40 dB, blue) times the maximum sensitivity.

