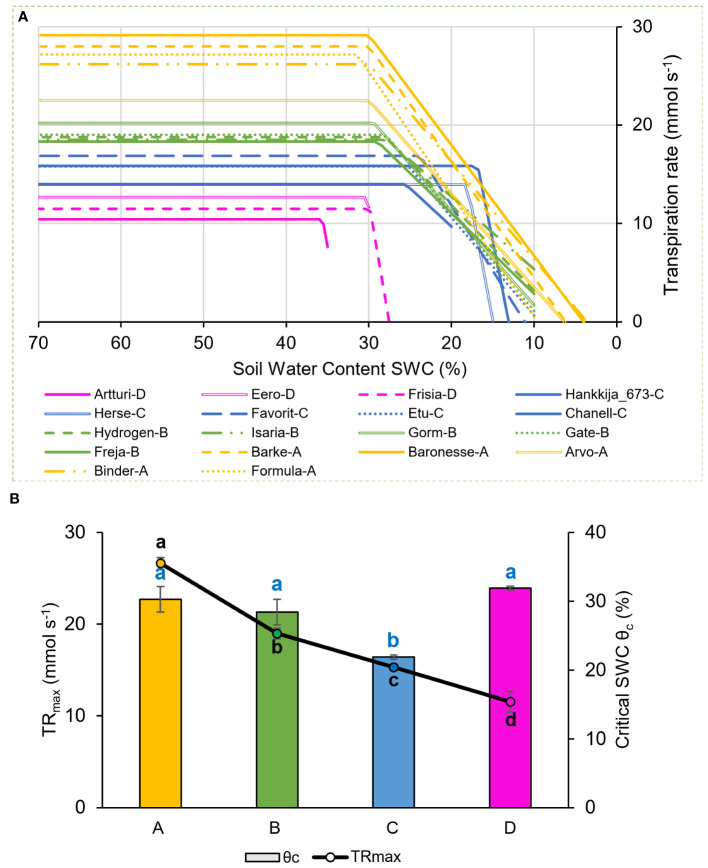
Figure 2.
Transpiration rate response to drought during 81-line screening. Behavior of 18-line subset shown. (A) Piece-wise fitted line between midday whole plant transpiration rate (mmol s-1) and soil water content (SWC). The four physiological groups are as in Figure 1 : A (yellow), B (green), C (blue), D (magenta). (B) Maximum transpiration rate (TRmax) and θc averaged for the four groups. Lowercase letters, significance levels for TRmax (black) and θc (blue).

