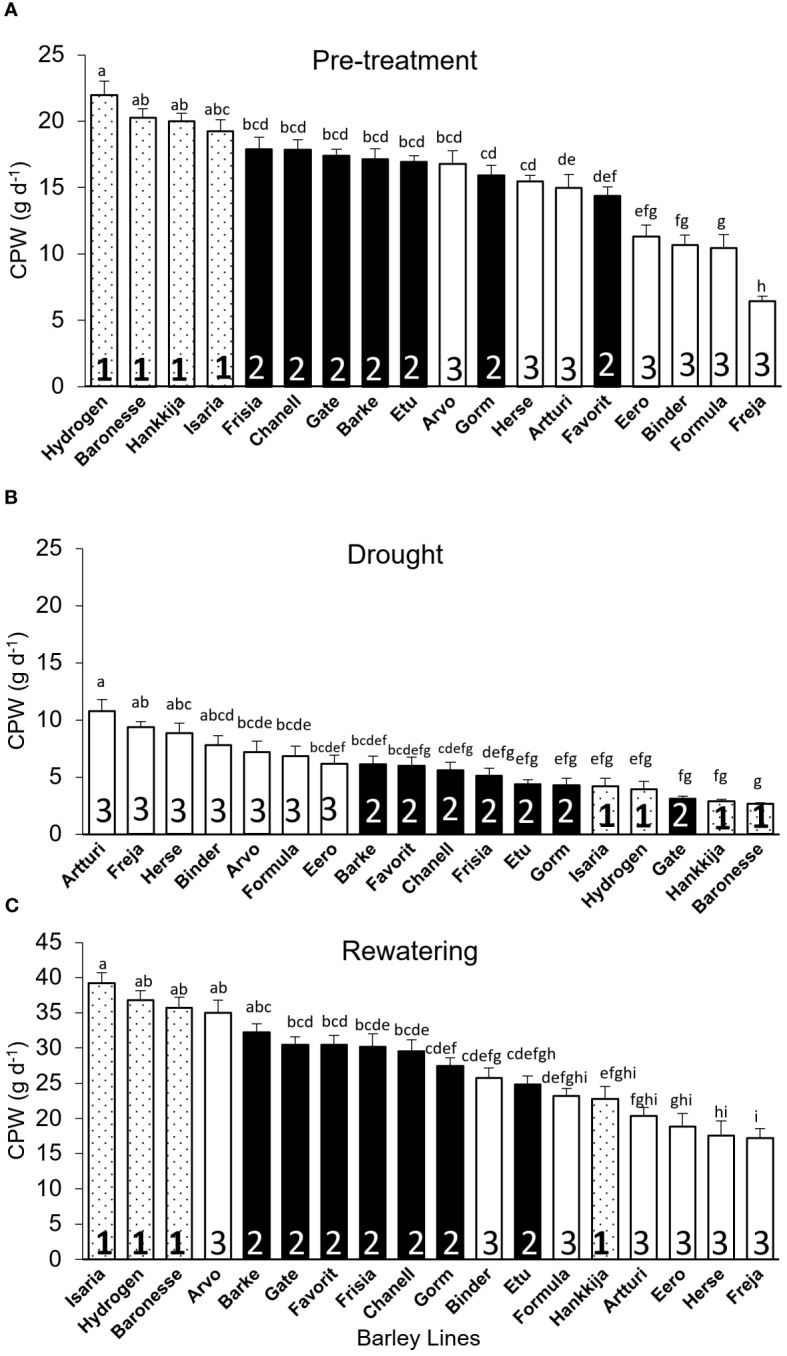
Figure 6.

Calculated Plant Weight (CPW) gain per day for the 18 barley lines grouped based on significant levels during DT-pre-treatment. Each treatment is the average of CPW from 5 consecutive days when the PAR and VPD are the most identical, and each line is from of 5 to 8 biological replicates. (A) Pre-treatment (average of day 7–11). (B) Drought (average of day 22–26). (C) Recovery (average of day 51–55). For each phase, lines are arranged in descending CPW order. Lowercase letters indicate significance groups. Bars represent mean ± SE.
