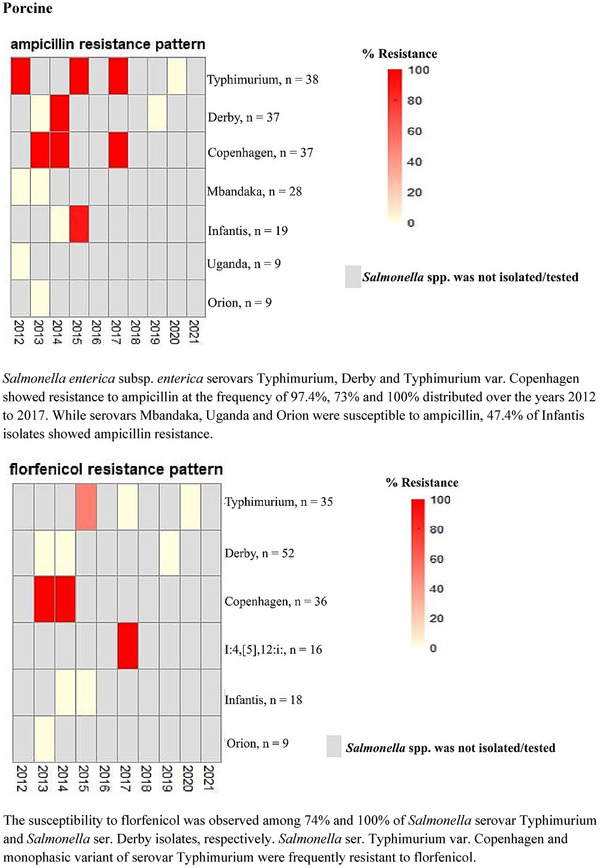
FIGURE 3.

Heat maps showing annual antimicrobial resistance trends for the most frequently tested Salmonella enterica serotypes from porcine samples (2012–2021). The colour‐coding gradient represents % resistance of the Salmonella serovars to antibiotics. Red depicts the resistance of all the isolates of a serovar tested to an antibiotic (100% resistance), whereas a gradient of lighter shades to pale pink shows susceptibility. Grey bars represent either the absence of specific serovar of Salmonella or Salmonella isolates not subjected to antimicrobial susceptibility testing. Salmonella enterica subsp. enterica serovars Typhimurium, Derby and Typhimurium var. Copenhagen showed resistance to ampicillin at the frequency of 97.4%, 73% and 100% distributed over the years 2012–2017. While serovars Mbandaka, Uganda and Orion were susceptible to ampicillin, 47.4% of Infantis isolates showed ampicillin resistance. The susceptibility to florfenicol was observed among 74% and 100% of Salmonella serovar Typhimurium and Salmonella ser. Derby isolates, respectively. Salmonella ser. Typhimurium var. Copenhagen and the monophasic variant of serovar Typhimurium were frequently resistant to florfenicol.
