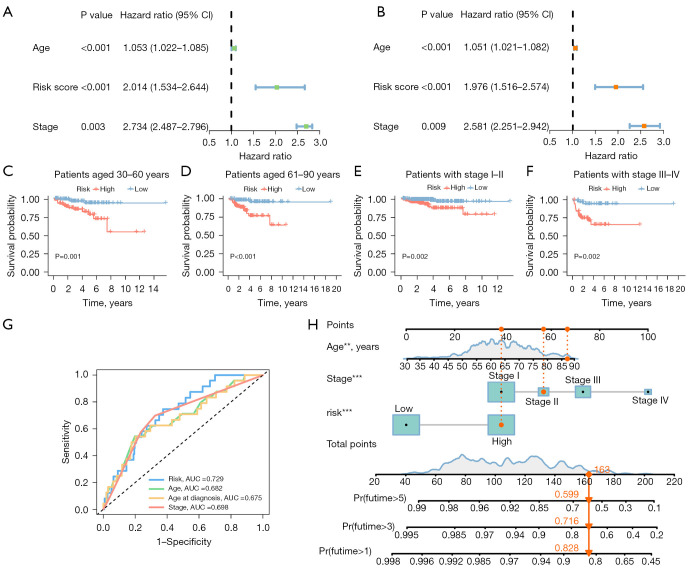
Figure 4.
Independent prognostic analysis. (A) A univariate Cox regression analysis shows risk score to be an independent prognostic factor. (B) A multivariate Cox regression analysis shows risk score to be an independent prognostic factor. (C-F) The survival curve shows that the risk model is applicable to patients with different clinical stages and ages. (G) ROC curve demonstrates the accuracy of risk models in predicting patient survival. (H) The nomogram for both clinic-pathological factors and prognostic immunogenic cell death-related lncRNAs. The log-rank test was applied to compare the OS rates of the high-risk and low-risk groups. **, P<0.01; ***, P<0.001. CI, confidence interval; AUC, area under the curve; ROC, receiver operating characteristic; lncRNAs, long non-coding RNAs; OS, overall survival.

