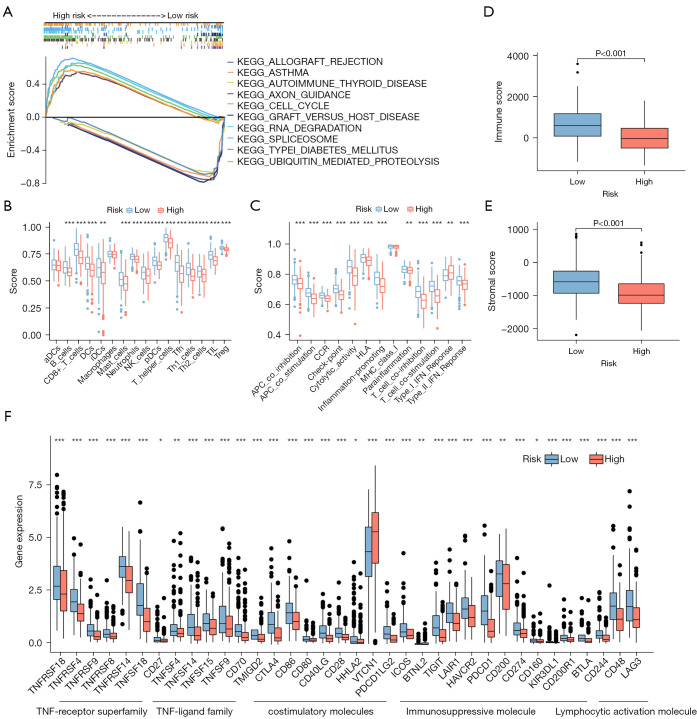
Figure 5.
Enrichment analysis of pathways and immune environment. (A) The top 5 KEGG signaling pathways in the high-risk and low-risk EC patients. (B,C) The ssGSEA scores of immune cells and immune function within the low- and high-risk groups. (D,E) Box plots of stromal score and immune score for the low- and high-risk groups. (F) The difference in immune checkpoint expression between low- and high-risk groups. Wilcox test was applied to compare data. *, P<0.05; **, P<0.01; ***, P<0.001. KEGG, Kyoto Encyclopedia of Genes and Genomes; EC, endometrial carcinoma; ssGSEA, single sample gene set enrichment analysis.

