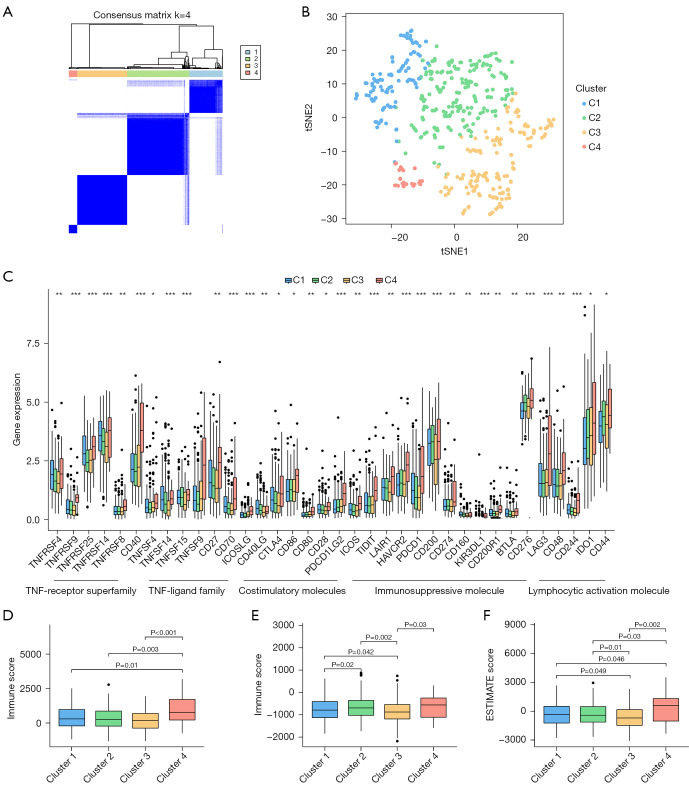
Figure 6.
Consensus clustering and immune infiltration analysis. (A) Consensus matrix when k =4. (B) tSNE analyses of 4 clusters. (C) The difference in immune checkpoint expression between clusters. (D-F) Box plots of stromal score, immune score, and ESTIMATE score for 4 clusters. Kruskal-Wallis H test was applied to compare data. P value corrected with Bonferroni. *, P<0.05; **, P<0.01; ***, P<0.001. tSNE, t-Distributed Stochastic Neighbor Embedding; ESTIMATE, Estimation of STromal and Immune cells in MAlignant Tumor tissues using Expression data.

