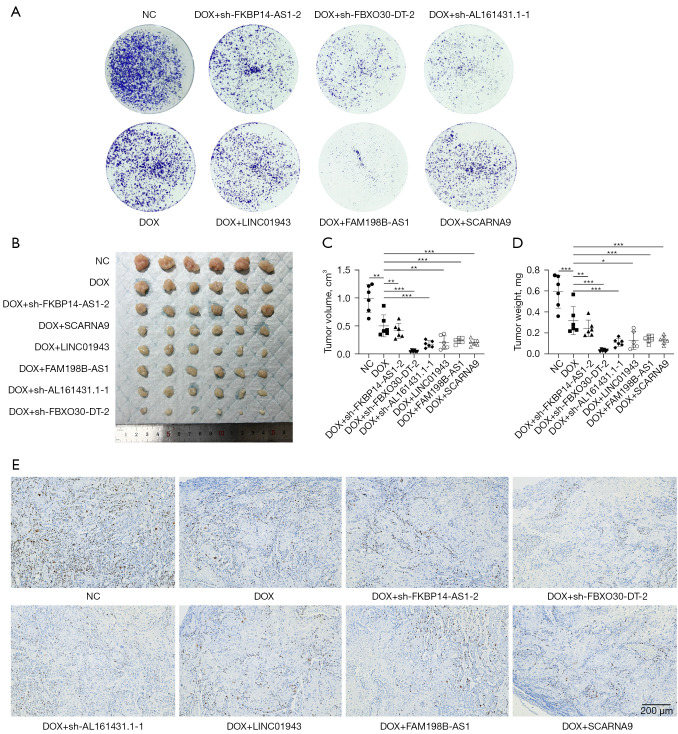
Figure 8.
Proliferation experiments in vivo and in vitro. (A) KLE cells transfected with sh-FKBP14-AS1, sh-FBXO30-DT, sh-AL161431.1, LINC01943 plasmid, FAM198B-AS1 plasmid, SCARNA9 plasmid reduces the number of colonies. Cells were stained with 0.1% crystal violet for 30 min. (B) Xenograft tumors at the endpoint. (C,D) Tumor volume and weight measured in BALB/c nude mice. (E) The relative protein levels of ki67 in xenograft tumors by immunohistochemistry. Cell nucleus was stained with DAPI. These experiments were performed at least in triplicate (magnification factor: ×40). One-way ANOVA test was applied to compare data for above two groups. *, P<0.05; **, P<0.01; ***, P<0.001. NC, negative control; DOX, doxorubicin; DAPI, 4',6-diamidino-2-phenylindole; ANOVA, analysis of variance.

