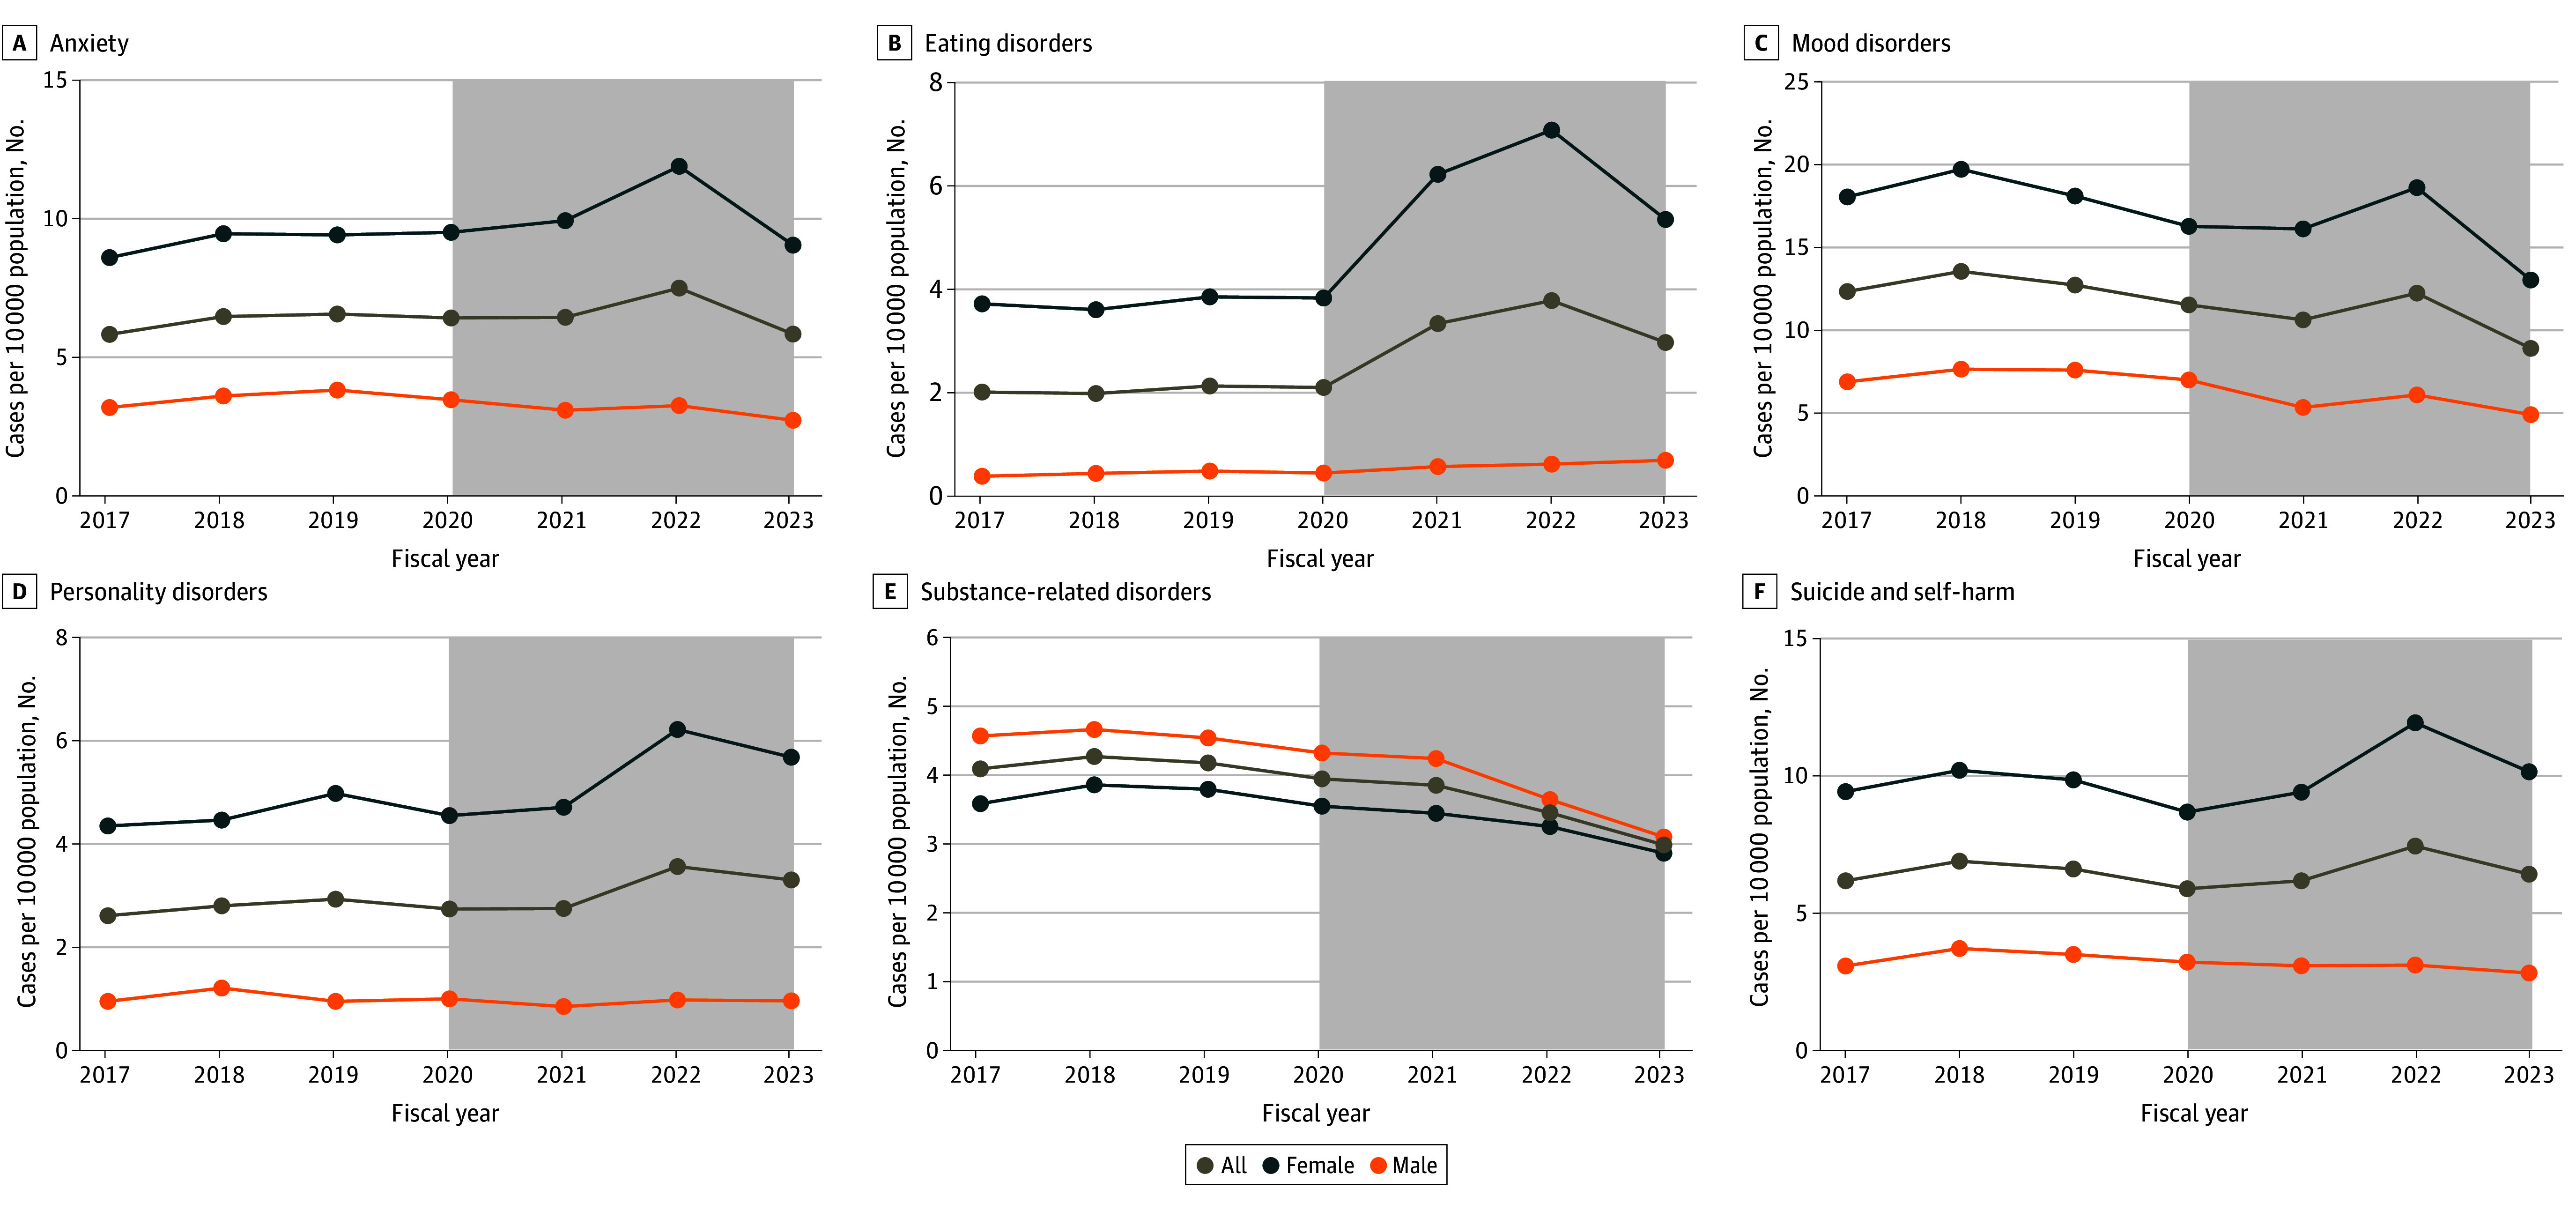
Figure 3. Rates of Mental Health Hospitalizations by 10 000 Person-Years for Each Diagnostic Subgroup, Stratified by Sex .

Gray shaded areas indicate the COVID-19–prevalent period from April 1, 2020, to March 31, 2023. Points correspond to aggregate data by fiscal year and are displayed at the end of the fiscal year (March 31).
