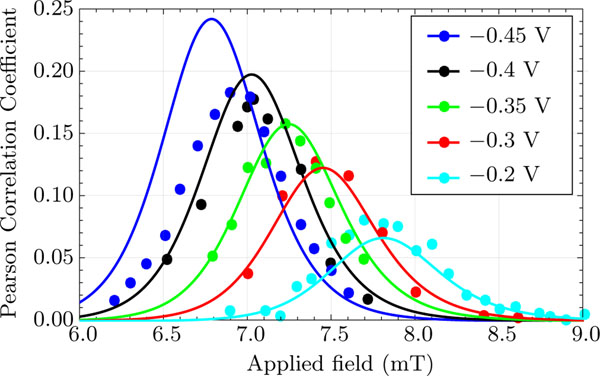
FIG. 6.
The correlation coefficient (equivalently the cross-correlation) between the states of the coupled SMTJs at a series of source voltages . Filled circles show the experimental data; curves are the model predictions based on the Markov model described in Appendix B using the Néel-Brown fits to isolated SMTJs described in Appendix A. The single standard deviation uncertainties for the experimental points are smaller than the symbols. They are a result of the finite number of intervals measured in each state.

