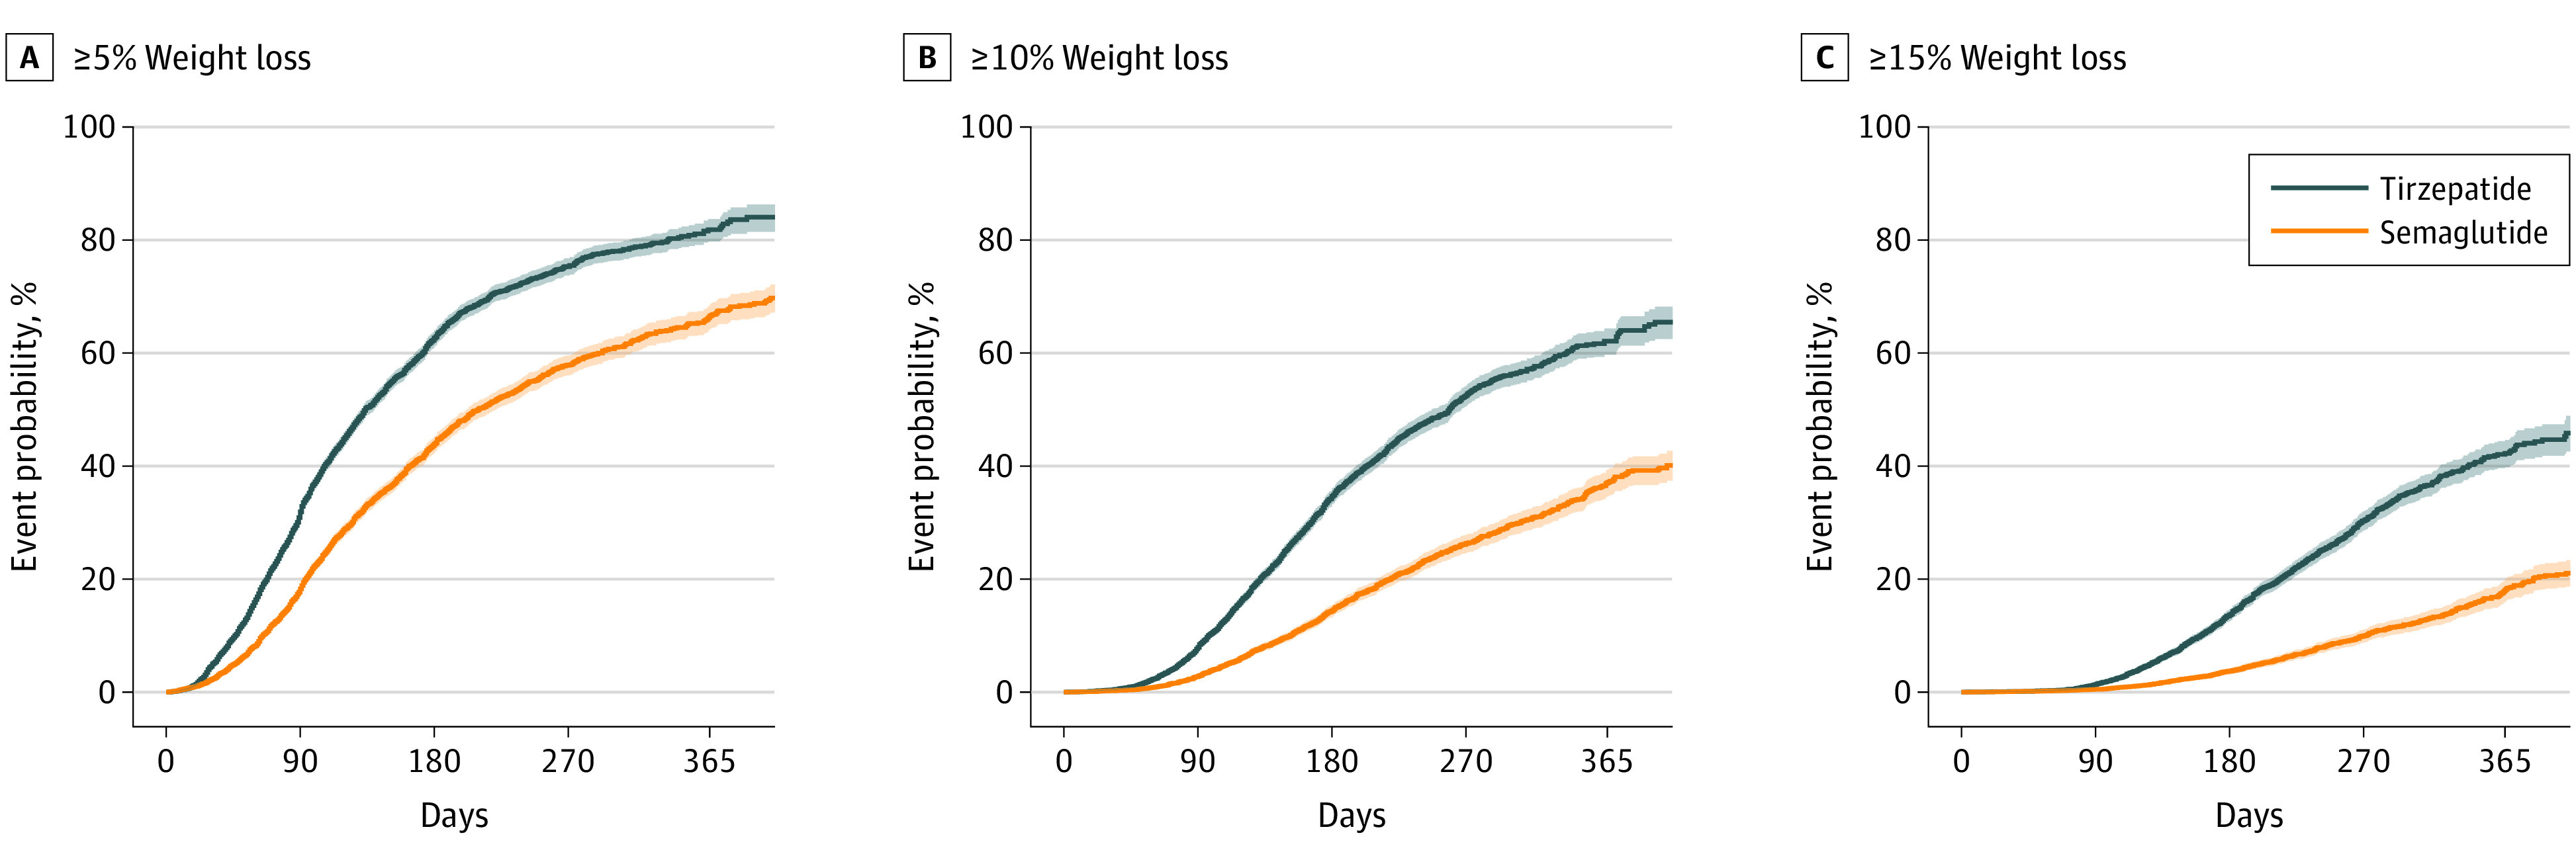
Figure 2. Event Probabilities for 5% or Greater, 10% or Greater, and 15% or Greater Weight Reduction Among Propensity-Score Matched Patients on Treatment.

The y-axis represents the event probability (1-survival probability [eg, probability of being event-free]).
