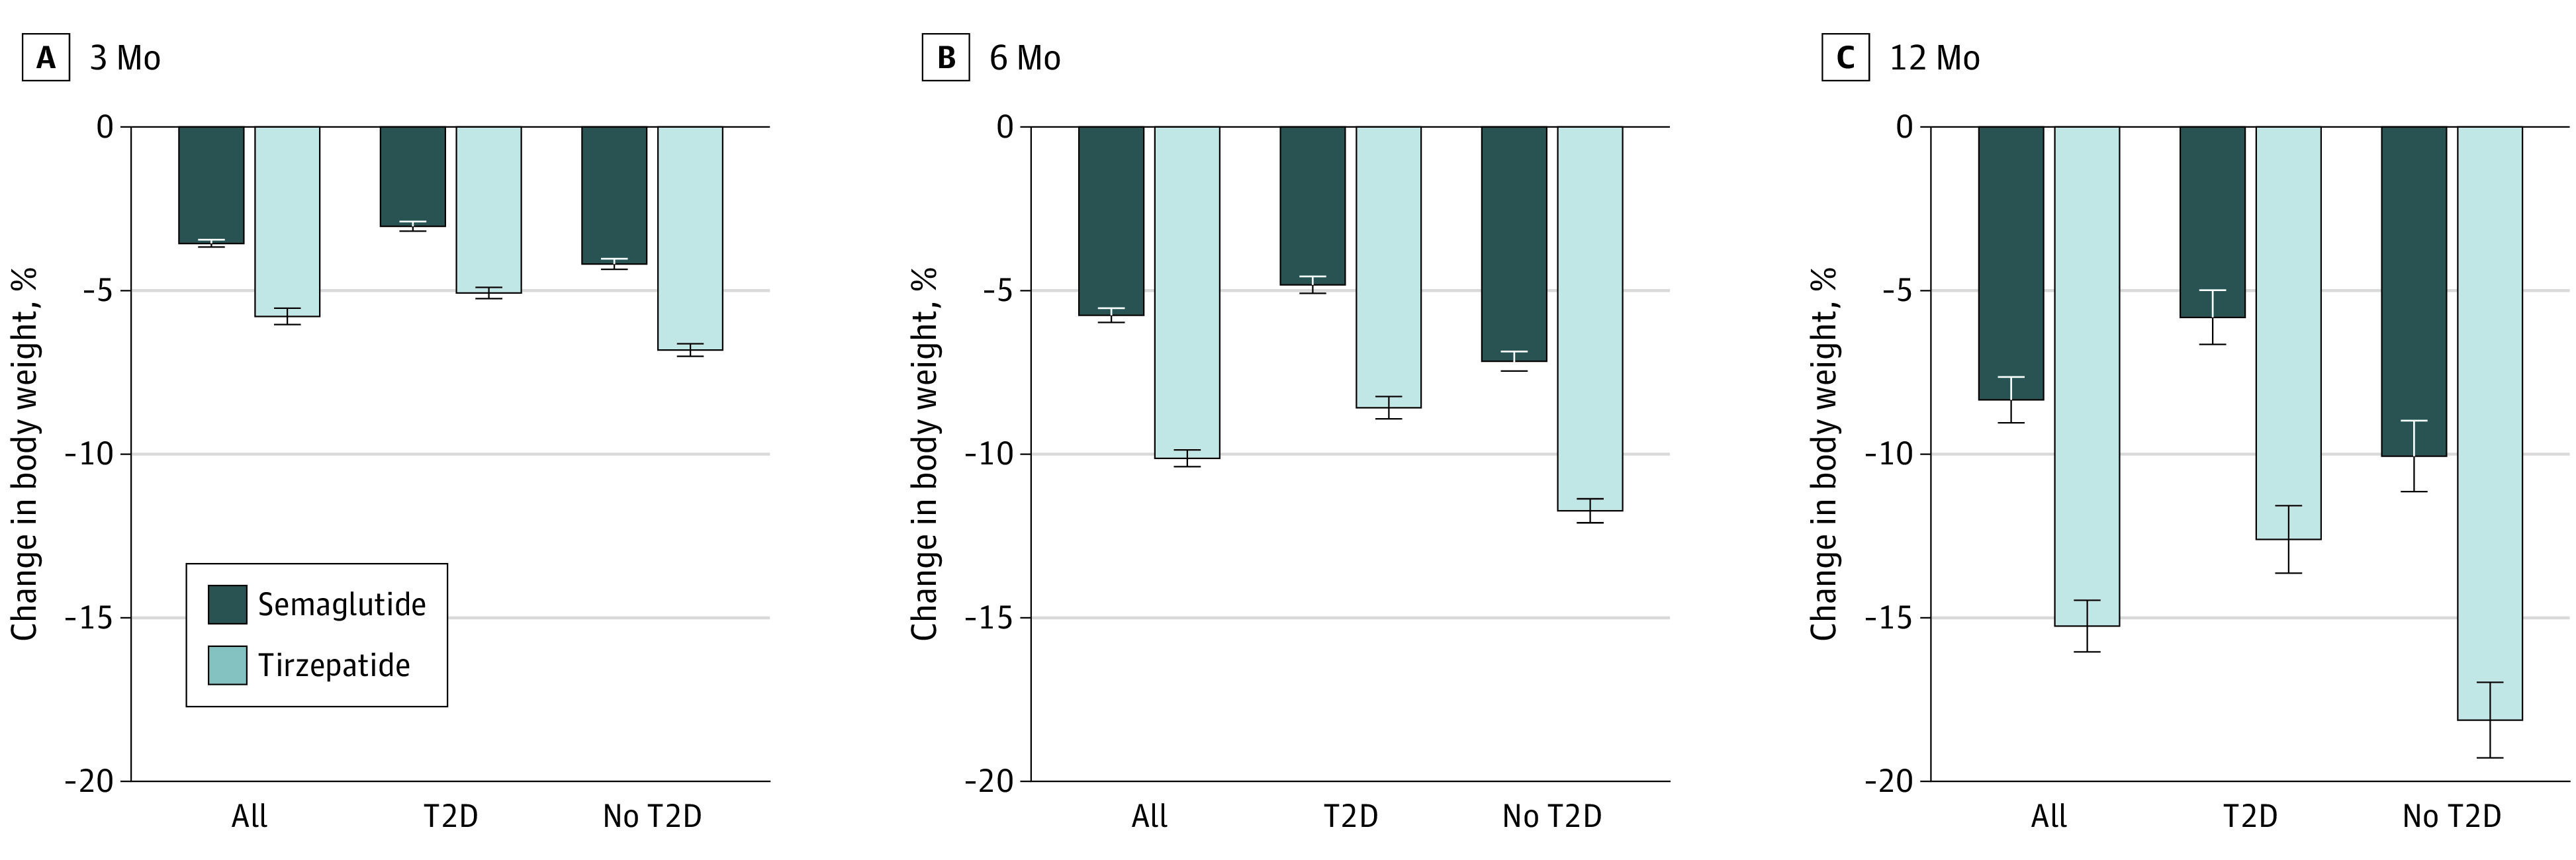
Figure 3. Mean Percentage Change in Body Weight at 3, 6, and 12 Months Receiving Treatment for the Overall Population, Those With Type 2 Diabetes (T2D), and Those Without T2D.

Bars represent mean changes in body weight from baseline to the time point among the propensity score matched population of patients still receiving treatment. The whiskers represent 95% CIs.
