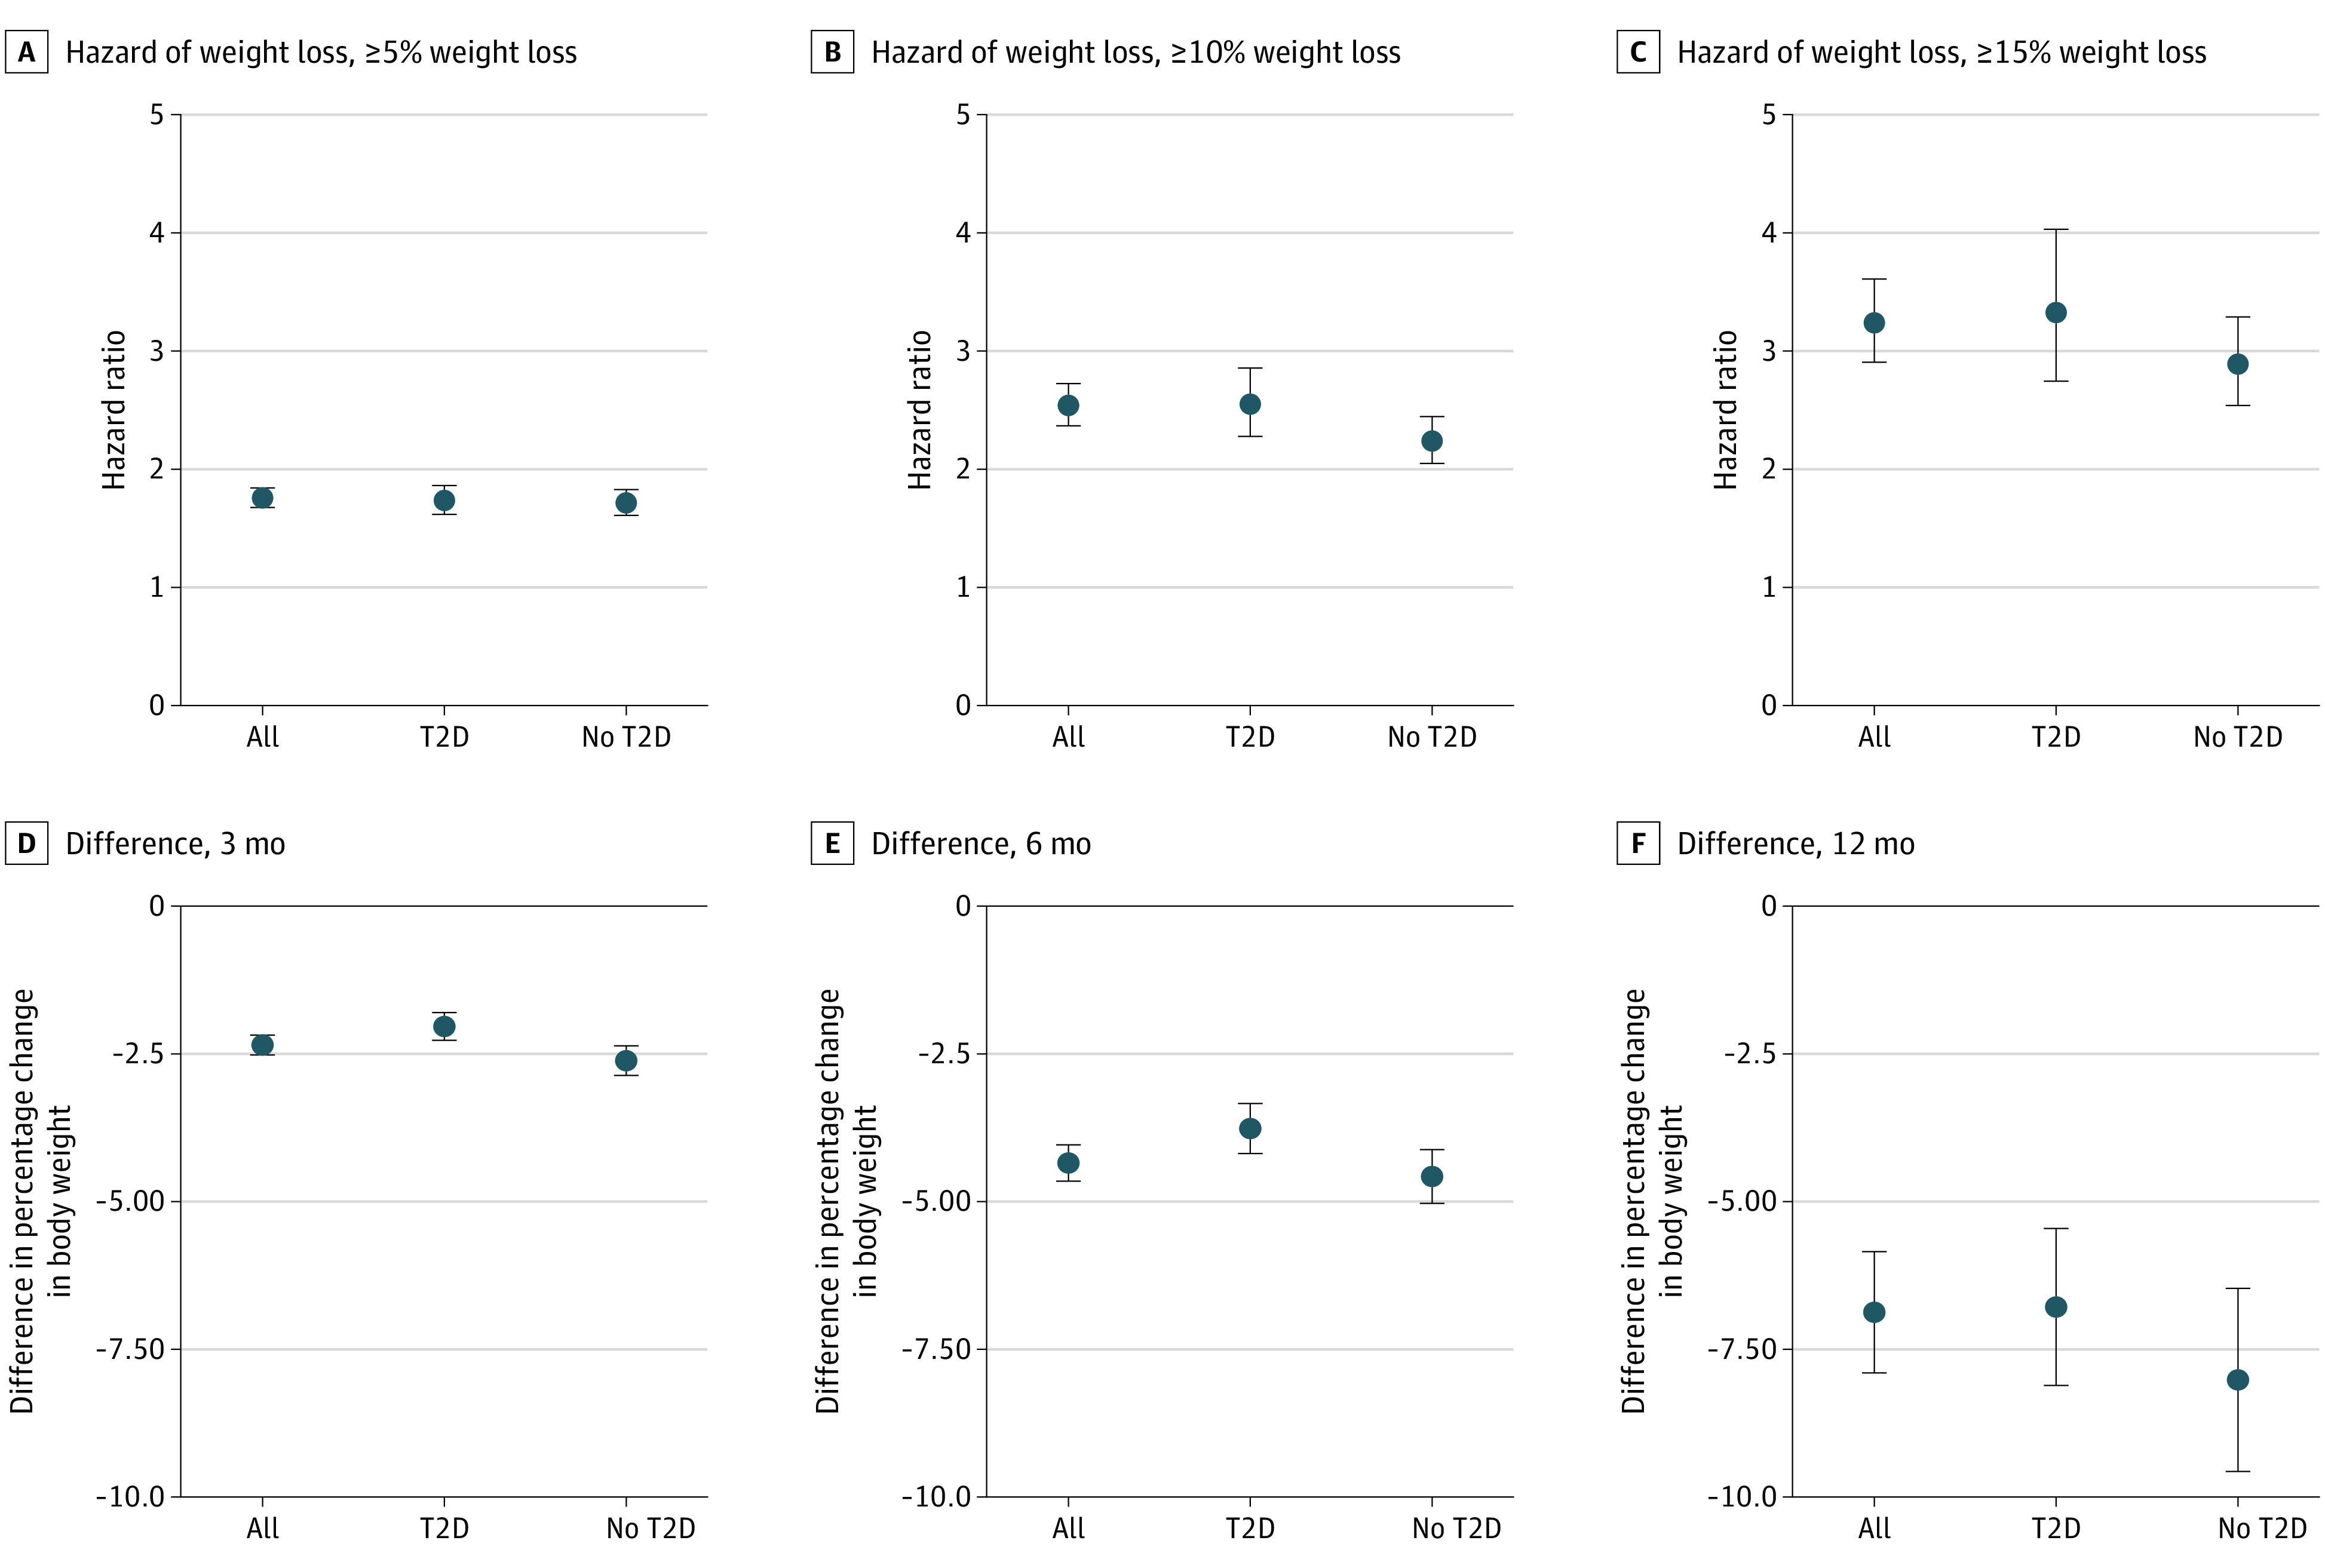
Figure 4. Treatment Effects Comparing Tirzepatide to Semaglutide for All Patients, Patients With Type 2 Diabetes (T2D), and Patients Without T2D.

Points represent point estimates; the whiskers represent 95% CIs. Panels A-C contain hazard ratios for achieving 5% or greater, 10% or greater, and 15% or greater weight loss for patients receiving tirzepatide vs semaglutide among propensity score matched populations. Hazard ratios greater than 1 indicate higher likelihood of reaching weight loss threshold with tirzepatide. Panels D-F contain absolute differences in body weight change at 3 months, 6 months, and 12 months for patients receiving tirzepatide vs semaglutide among propensity score matched populations still receiving treatment at the time point. Negative differences indicate greater weight loss with tirzepatide.
