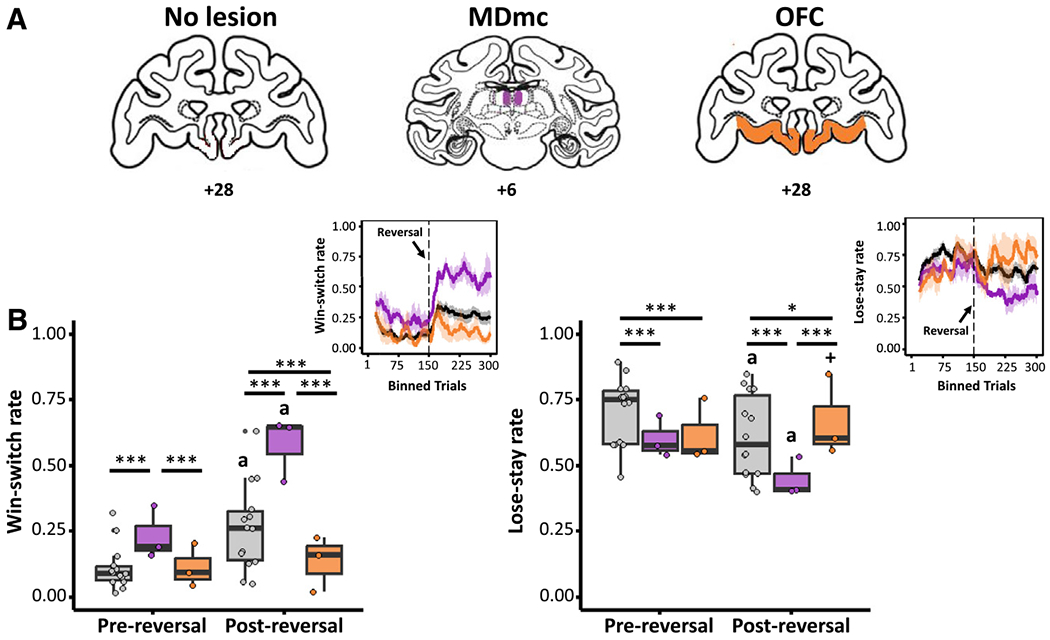
Figure 2. Behavior of lesioned monkeys.

(A) Illustrations of the anatomical brain lesion locations in monkeys, where the excitotoxic MDmc and OFC lesion locations are illustrated on standard coronal sections from a monkey brain atlas (Laboratory of Neuropsychology, National Institute of Mental Health). Prior studies show the actual lesion locations of the MDmc and OFC in individual monkeys.13,22
(B) Differences in win-switch behavior (left) and lose-stay behavior (right) for the lesion groups between pre-reversal and post-reversal phases. Top right: PRL behaviors over time (moving average across 20 lagged trials) of win-switch (left) and lose-stay (right) choices across lesion groups, with a reversal occurring after 150 trials.
Each data point overlaid indicates an individual monkey’s data. Asterisks indicate significant effects of lesion group within each reversal phase (***p < 0.001, *p < 0.05; GLMM). Other symbols indicate significant effects of reversal phase within each lesion group (a, p < 0.001; +, p < 0.10).
