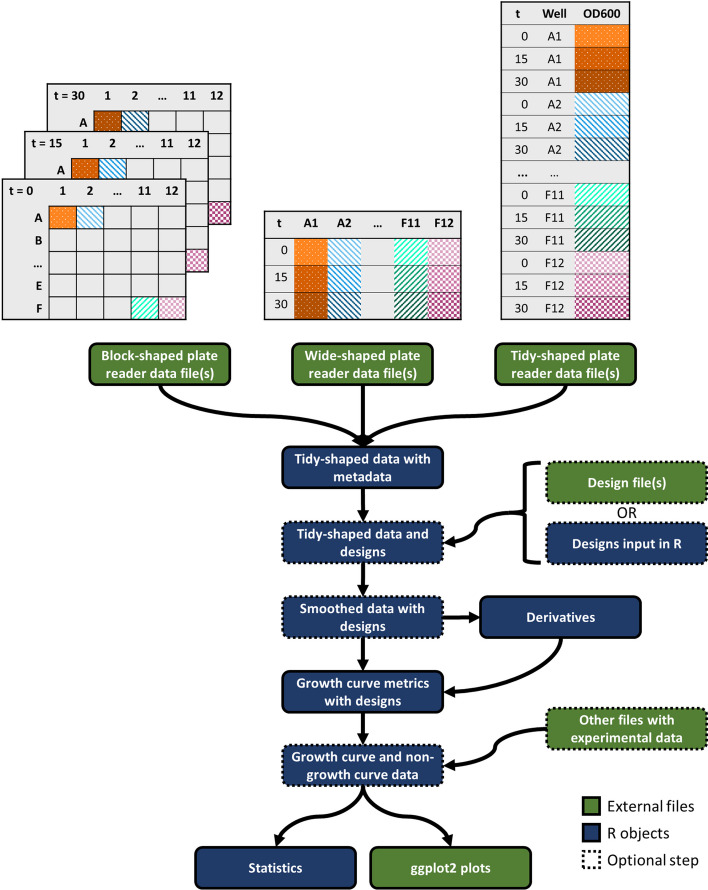
Fig. 1.
Workflow to use gcplyr to analyze microbial growth curve data. Growth curve data are commonly found in one of three layouts: block-shaped, wide-shaped, or tidy-shaped. Block-shaped data are organized to match the physical layout of the multi-well plate. Wide-shaped data contain one column for each well from a plate. Tidy data contain all the observations in a single column. gcplyr functions import data files regardless of the data layout, reshape them into tidy-shaped data, then merge them with experimental design information. Data and designs can then be smoothed and have derivatives calculated before extracting growth curve metrics. Metrics can be easily merged with other non-growth curve experimental data before statistical analyses and visualization

