Figure 3.
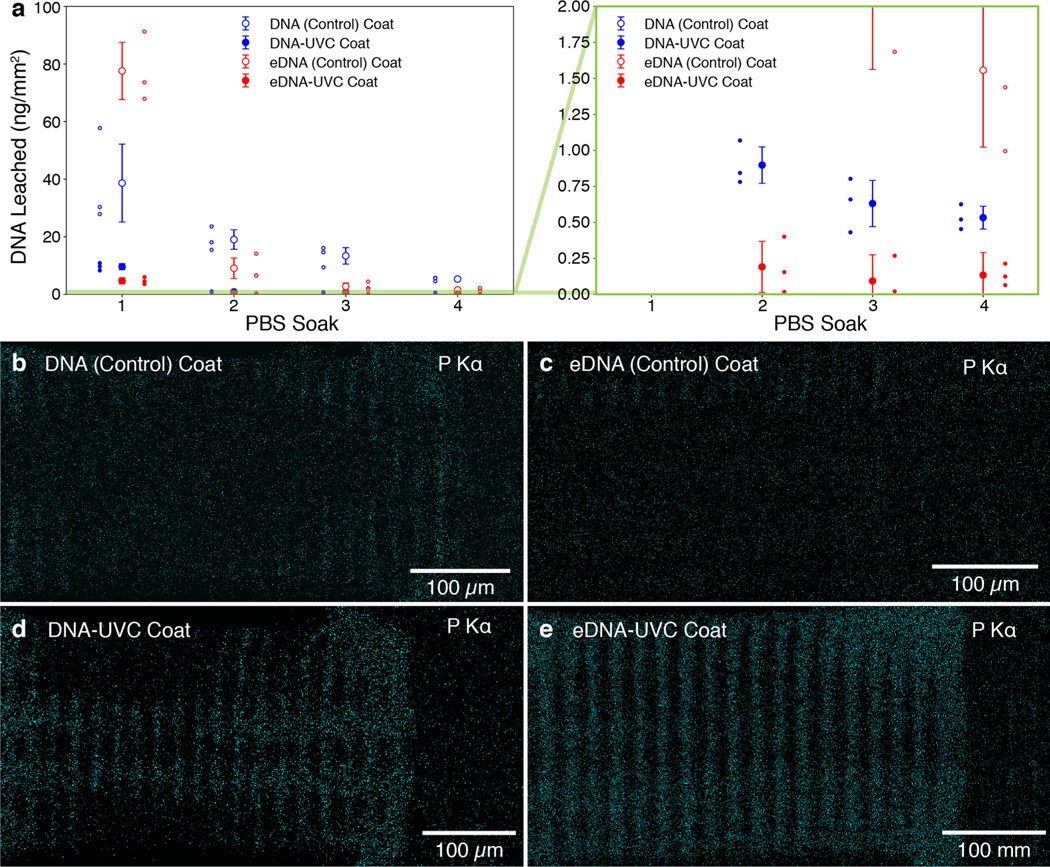
DNA leaching studies conducted on four different categories of DNA-coated lattices. (a) Amount of DNA leached normalized by surface area over multiple PBS soaks, as determined by UV–vis spectroscopy. Data points and error bars correspond to the mean and error-propagated standard deviations of the set (n = 3). Plot on the right contains a zoomed-in section of the original plot, outlined by the green rectangle, which shows that all UVC-treated lattices show a considerable decrease in the amount of leached DNA (<1 ng mm−2). Each individual data point in the set is also shown. Phosphorus maps of the (b) DNA (Control), (c) eDNA (Control), (d) DNA-UVC, and (e) eDNA-UVC coated lattices. Little to no DNA was detected on the DNA (Control) and eDNA (Control) lattices. DNA can clearly be seen on the grooves of the horizontal beams for the DNA-UVC and eDNA-UVC lattices.

