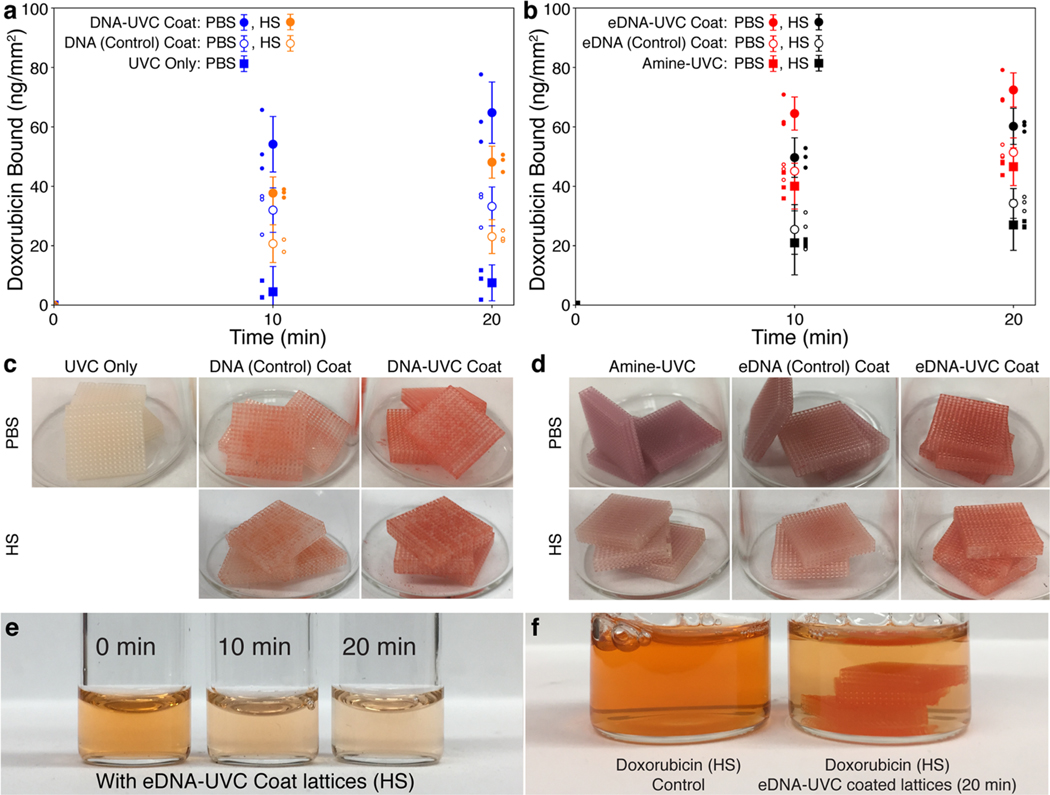
Figure 4.
Doxorubicin capture in PBS and HS. The cumulative amount of doxorubicin bound over 20 min, as determined by fluorescence, normalized by surface area for the (a) DNA-UVC lattices and the associated controls in PBS (blue) and HS (orange) as well as (b) eDNA-UVC lattices and the associated controls in PBS (red) and HS (black). All points and error bars show the mean and error-propagated standard deviations of the set (n = 3). Each individual data point in the set is also shown. (c) DNA-UVC lattices and its controls and (d) eDNA-UVC lattices and its controls after the doxorubicin tests in PBS and HS. (e) Color of the doxorubicin HS solution at various time points during the doxorubicin binding experiments. (f) Comparison of color between the initial doxorubicin HS solution and the solution 20 min after the eDNA-UVC lattices have been introduced. The lattices also turned from white to red.

