FIGURE 3.

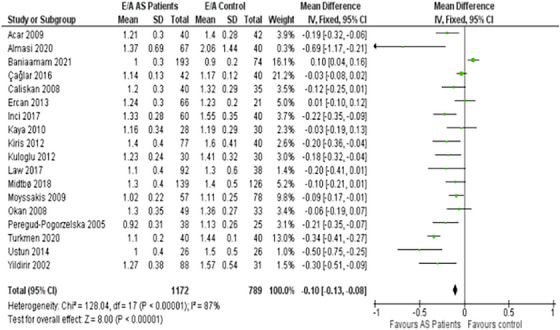
Forest plot depicting the distribution of Early (E) and Late (atrial—A) ventricular filling velocity (E/A) ratio among the included studies.

Forest plot depicting the distribution of Early (E) and Late (atrial—A) ventricular filling velocity (E/A) ratio among the included studies.