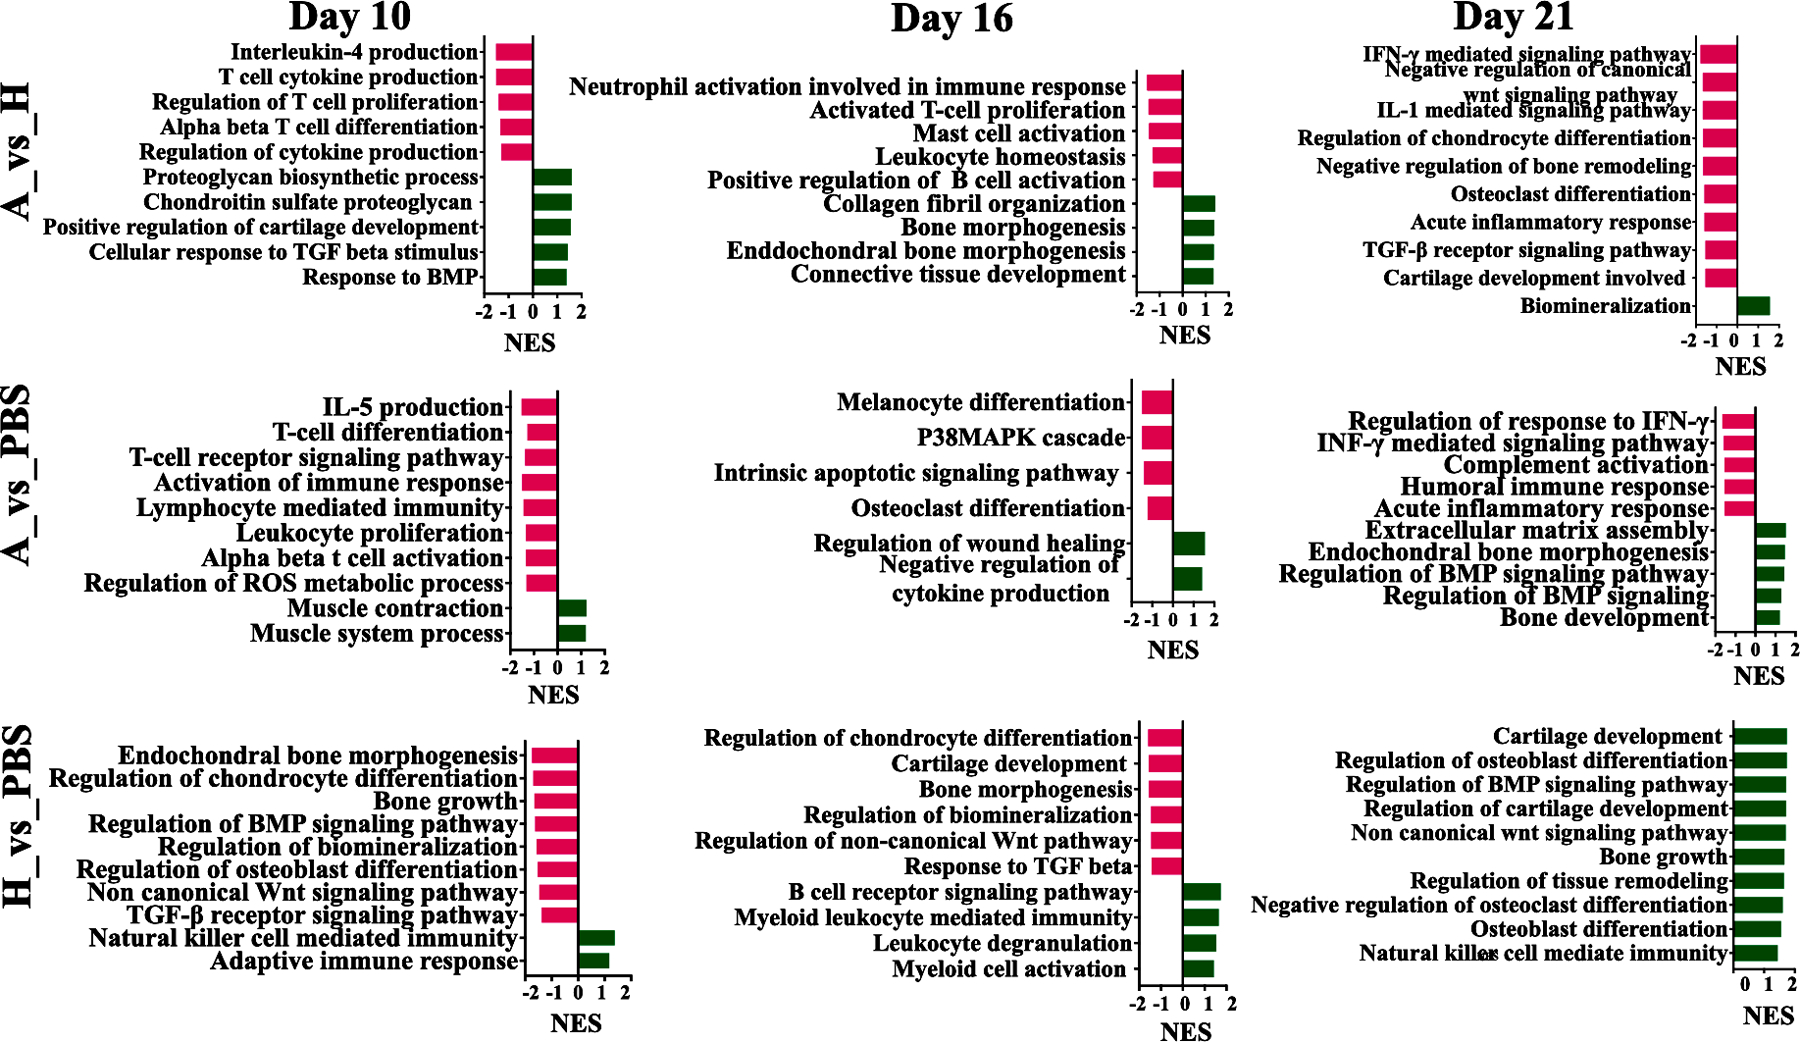
Figure .10. GSEA Analysis.

GSEA plots with gene ontology biological process gene sets are shown for the Atsttrin-loaded hydrogel, hydrogel and PBS-treated groups during healing and at day 10, 16, and 21 post-fracture. Red and green bars represent the down-regulated and up-regulated signal pathways, respectively. Atsttrin-loaded hydrogel_vs_Hydrogel (A_vs_H), Atsttrin-loaded hydrogel_vs_PBS (A_vs_PBS), and Hydrogel_vs_PBS (H_vs_PBS). The Normalized Enrichment Scores (NES) are indicated.
