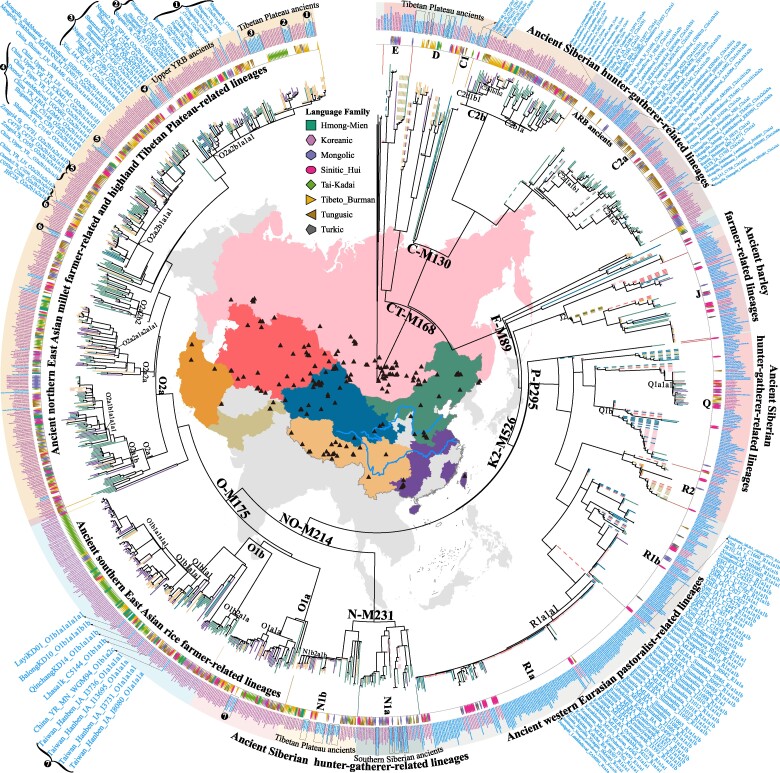
Fig. 2.
Maximum likelihood phylogenetic tree among modern and ancient Eurasian populations. This tree includes newly genotyped individuals from Chinese ethnic minorities and ancient Eurasian reference populations. The colored regions on the map signify the sampling locations of both ancient and modern Eurasian populations, with black triangles marking the sites where ancient Eurasian samples were collected. The branch lengths are proportional to the mutation counts, and the branch colors indicate the sampling locations, with solid lines representing modern individuals and dashed lines depicting ancient individuals. Inside the circle, different shapes and colors denote the language families of modern individuals: rosy for Sinitic; dark goldenrod for Tibeto-Burman; bluish violet for Mongolic; brown for Tungusic; gray for Turkic; lavender for Koreanic; green for Tai-Kadai; and medium sea green for Hmong-Mien. Due to the small sample sizes (fewer than five), Austronesian, Austroasiatic, and Indo-European-speaking populations are not labeled. The outer circle displays sample information and corresponding haplogroup results, with violet representing modern individuals and light blue for ancient ones. Enlargements of dominant lineages and their representative ancient genomes are highlighted at the four corners of the map. Detailed views of these branches are provided in supplementary figs. S9 to S12, Supplementary Material online.

