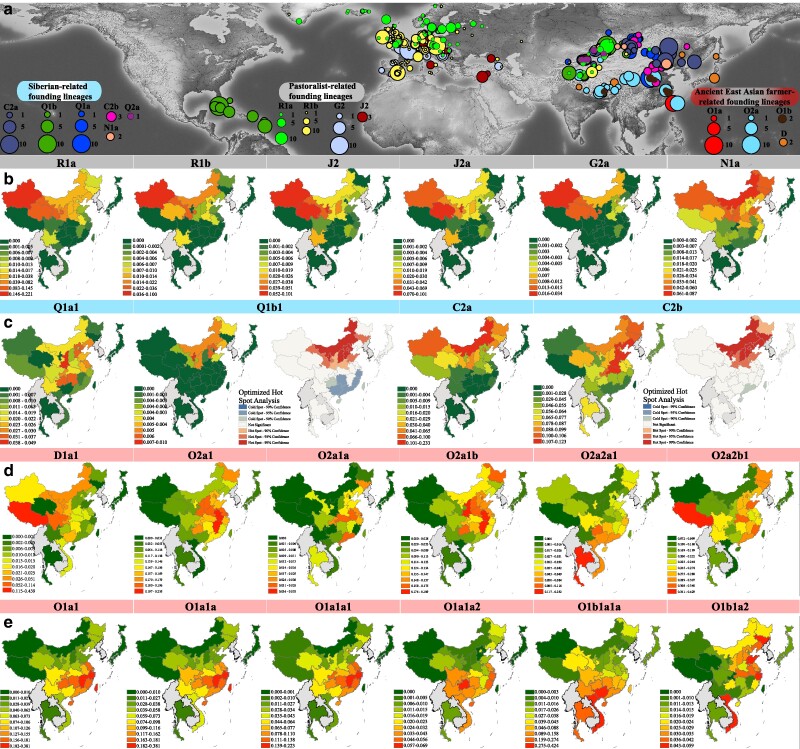
Fig. 3.
Frequency spectrum of dominant Chinese paternal lineages in ancient Eurasians and modern East and Southeast Asians. a) The geographic distribution of 1,284 ancient individuals carrying 12 Y-chromosome lineages is depicted. Various haplogroups are represented by circles of different colors, with the size of each circle proportional to the frequency of the corresponding haplogroups. b and c) Frequencies of paternal lineages related to Western-origin and Siberian hunter-gatherers among eastern Eurasian populations are shown. Optimized hot spot analysis was employed to suggest the geographic origins of these focused lineages. d and e) Frequencies of sublineages associated with early East Asian-related D, ANEA millet farmer-related O2, and ancient Southern East Asian rice farmer-related O1 are displayed. Areas with high frequencies or significant phylogeographic relevance of the studied lineages are highlighted in hot red. Detailed frequency distributions of additional sublineages are provided in supplementary figs. S13 and S16 to S18, Supplementary Material online.

