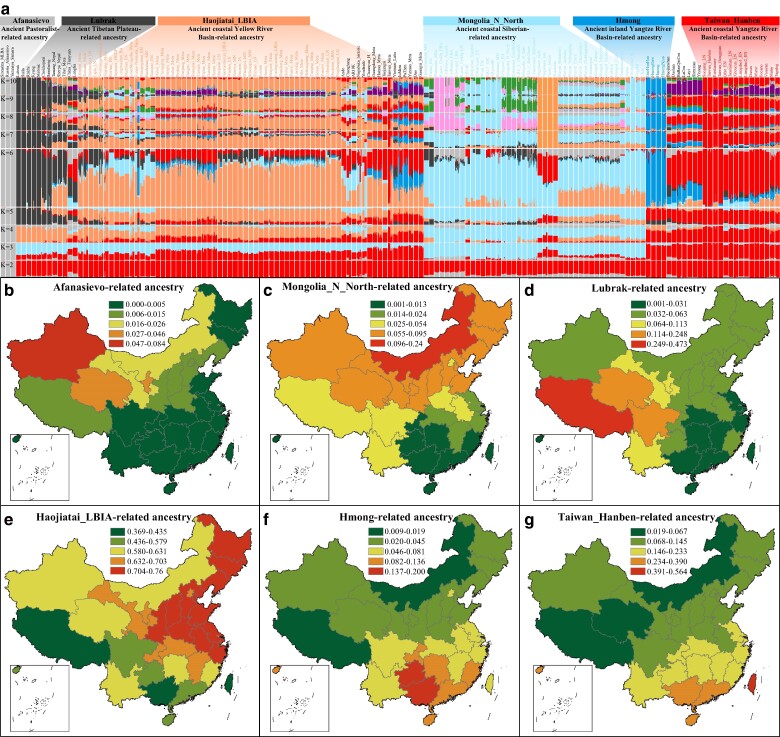
Fig. 4.
Admixture results and geographic distribution of ancestral sources. a) Model-based ADMIXTURE analysis was performed for modern and ancient East Asian populations using predefined ancestral sources ranging from 2 to 15. The optimal fit was achieved with a six-way admixture model, which exhibited the lowest cross-validation error. b to g) The distribution of admixture proportions across various Chinese populations is depicted, with red indicating the highest proportion of a specific ancestral component.

