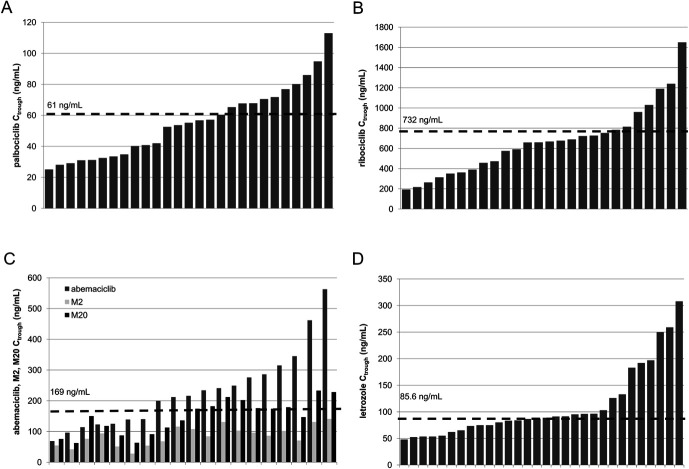
FIGURE 2.
Plasma concentrations of palbociclib (panel A), ribociclib (panel B), abemaciclib (panels C and E), M2 (panel E), M20 (panel E), and letrozole (panel D) in patients. Multiple samples were collected from some patients: Patients 11, 15, 16, and 22 of ribociclib and 3 and 22 of abemaciclib; empty circles correspond to concentrations not reaching Ctrough.

